- Docs Home
- About TiDB
- Quick Start
- Develop
- Overview
- Quick Start
- Build a TiDB Cluster in TiDB Cloud (Developer Tier)
- CRUD SQL in TiDB
- Build a Simple CRUD App with TiDB
- Example Applications
- Connect to TiDB
- Design Database Schema
- Write Data
- Read Data
- Transaction
- Optimize
- Troubleshoot
- Reference
- Cloud Native Development Environment
- Third-party Support
- Deploy
- Software and Hardware Requirements
- Environment Configuration Checklist
- Plan Cluster Topology
- Install and Start
- Verify Cluster Status
- Test Cluster Performance
- Migrate
- Overview
- Migration Tools
- Migration Scenarios
- Migrate from Aurora
- Migrate MySQL of Small Datasets
- Migrate MySQL of Large Datasets
- Migrate and Merge MySQL Shards of Small Datasets
- Migrate and Merge MySQL Shards of Large Datasets
- Migrate from CSV Files
- Migrate from SQL Files
- Migrate from One TiDB Cluster to Another TiDB Cluster
- Migrate from TiDB to MySQL-compatible Databases
- Advanced Migration
- Integrate
- Overview
- Integration Scenarios
- Maintain
- Monitor and Alert
- Troubleshoot
- TiDB Troubleshooting Map
- Identify Slow Queries
- Analyze Slow Queries
- SQL Diagnostics
- Identify Expensive Queries Using Top SQL
- Identify Expensive Queries Using Logs
- Statement Summary Tables
- Troubleshoot Hotspot Issues
- Troubleshoot Increased Read and Write Latency
- Save and Restore the On-Site Information of a Cluster
- Troubleshoot Cluster Setup
- Troubleshoot High Disk I/O Usage
- Troubleshoot Lock Conflicts
- Troubleshoot TiFlash
- Troubleshoot Write Conflicts in Optimistic Transactions
- Troubleshoot Inconsistency Between Data and Indexes
- Performance Tuning
- Tuning Guide
- Configuration Tuning
- System Tuning
- Software Tuning
- SQL Tuning
- Overview
- Understanding the Query Execution Plan
- SQL Optimization Process
- Overview
- Logic Optimization
- Physical Optimization
- Prepare Execution Plan Cache
- Control Execution Plans
- Tutorials
- TiDB Tools
- Overview
- Use Cases
- Download
- TiUP
- Documentation Map
- Overview
- Terminology and Concepts
- Manage TiUP Components
- FAQ
- Troubleshooting Guide
- Command Reference
- Overview
- TiUP Commands
- TiUP Cluster Commands
- Overview
- tiup cluster audit
- tiup cluster check
- tiup cluster clean
- tiup cluster deploy
- tiup cluster destroy
- tiup cluster disable
- tiup cluster display
- tiup cluster edit-config
- tiup cluster enable
- tiup cluster help
- tiup cluster import
- tiup cluster list
- tiup cluster patch
- tiup cluster prune
- tiup cluster reload
- tiup cluster rename
- tiup cluster replay
- tiup cluster restart
- tiup cluster scale-in
- tiup cluster scale-out
- tiup cluster start
- tiup cluster stop
- tiup cluster template
- tiup cluster upgrade
- TiUP DM Commands
- Overview
- tiup dm audit
- tiup dm deploy
- tiup dm destroy
- tiup dm disable
- tiup dm display
- tiup dm edit-config
- tiup dm enable
- tiup dm help
- tiup dm import
- tiup dm list
- tiup dm patch
- tiup dm prune
- tiup dm reload
- tiup dm replay
- tiup dm restart
- tiup dm scale-in
- tiup dm scale-out
- tiup dm start
- tiup dm stop
- tiup dm template
- tiup dm upgrade
- TiDB Cluster Topology Reference
- DM Cluster Topology Reference
- Mirror Reference Guide
- TiUP Components
- PingCAP Clinic Diagnostic Service
- TiDB Operator
- Dumpling
- TiDB Lightning
- TiDB Data Migration
- About TiDB Data Migration
- Architecture
- Quick Start
- Deploy a DM cluster
- Tutorials
- Advanced Tutorials
- Maintain
- Cluster Upgrade
- Tools
- Performance Tuning
- Manage Data Sources
- Manage Tasks
- Export and Import Data Sources and Task Configurations of Clusters
- Handle Alerts
- Daily Check
- Reference
- Architecture
- Command Line
- Configuration Files
- OpenAPI
- Compatibility Catalog
- Secure
- Monitoring and Alerts
- Error Codes
- Glossary
- Example
- Troubleshoot
- Release Notes
- Backup & Restore (BR)
- Point-in-Time Recovery
- TiDB Binlog
- TiCDC
- Dumpling
- sync-diff-inspector
- TiSpark
- Reference
- Cluster Architecture
- Key Monitoring Metrics
- Secure
- Privileges
- SQL
- SQL Language Structure and Syntax
- SQL Statements
ADD COLUMNADD INDEXADMINADMIN CANCEL DDLADMIN CHECKSUM TABLEADMIN CHECK [TABLE|INDEX]ADMIN SHOW DDL [JOBS|QUERIES]ADMIN SHOW TELEMETRYALTER DATABASEALTER INDEXALTER INSTANCEALTER PLACEMENT POLICYALTER TABLEALTER TABLE COMPACTALTER TABLE SET TIFLASH MODEALTER USERANALYZE TABLEBACKUPBATCHBEGINCHANGE COLUMNCOMMITCHANGE DRAINERCHANGE PUMPCREATE [GLOBAL|SESSION] BINDINGCREATE DATABASECREATE INDEXCREATE PLACEMENT POLICYCREATE ROLECREATE SEQUENCECREATE TABLE LIKECREATE TABLECREATE USERCREATE VIEWDEALLOCATEDELETEDESCDESCRIBEDODROP [GLOBAL|SESSION] BINDINGDROP COLUMNDROP DATABASEDROP INDEXDROP PLACEMENT POLICYDROP ROLEDROP SEQUENCEDROP STATSDROP TABLEDROP USERDROP VIEWEXECUTEEXPLAIN ANALYZEEXPLAINFLASHBACK TABLEFLUSH PRIVILEGESFLUSH STATUSFLUSH TABLESGRANT <privileges>GRANT <role>INSERTKILL [TIDB]LOAD DATALOAD STATSMODIFY COLUMNPREPARERECOVER TABLERENAME INDEXRENAME TABLEREPLACERESTOREREVOKE <privileges>REVOKE <role>ROLLBACKSAVEPOINTSELECTSET DEFAULT ROLESET [NAMES|CHARACTER SET]SET PASSWORDSET ROLESET TRANSACTIONSET [GLOBAL|SESSION] <variable>SHOW ANALYZE STATUSSHOW [BACKUPS|RESTORES]SHOW [GLOBAL|SESSION] BINDINGSSHOW BUILTINSSHOW CHARACTER SETSHOW COLLATIONSHOW [FULL] COLUMNS FROMSHOW CONFIGSHOW CREATE PLACEMENT POLICYSHOW CREATE SEQUENCESHOW CREATE TABLESHOW CREATE USERSHOW DATABASESSHOW DRAINER STATUSSHOW ENGINESSHOW ERRORSSHOW [FULL] FIELDS FROMSHOW GRANTSSHOW INDEX [FROM|IN]SHOW INDEXES [FROM|IN]SHOW KEYS [FROM|IN]SHOW MASTER STATUSSHOW PLACEMENTSHOW PLACEMENT FORSHOW PLACEMENT LABELSSHOW PLUGINSSHOW PRIVILEGESSHOW [FULL] PROCESSSLISTSHOW PROFILESSHOW PUMP STATUSSHOW SCHEMASSHOW STATS_HEALTHYSHOW STATS_HISTOGRAMSSHOW STATS_METASHOW STATUSSHOW TABLE NEXT_ROW_IDSHOW TABLE REGIONSSHOW TABLE STATUSSHOW [FULL] TABLESSHOW [GLOBAL|SESSION] VARIABLESSHOW WARNINGSSHUTDOWNSPLIT REGIONSTART TRANSACTIONTABLETRACETRUNCATEUPDATEUSEWITH
- Data Types
- Functions and Operators
- Overview
- Type Conversion in Expression Evaluation
- Operators
- Control Flow Functions
- String Functions
- Numeric Functions and Operators
- Date and Time Functions
- Bit Functions and Operators
- Cast Functions and Operators
- Encryption and Compression Functions
- Locking Functions
- Information Functions
- JSON Functions
- Aggregate (GROUP BY) Functions
- Window Functions
- Miscellaneous Functions
- Precision Math
- Set Operations
- List of Expressions for Pushdown
- TiDB Specific Functions
- Clustered Indexes
- Constraints
- Generated Columns
- SQL Mode
- Table Attributes
- Transactions
- Garbage Collection (GC)
- Views
- Partitioning
- Temporary Tables
- Cached Tables
- Character Set and Collation
- Placement Rules in SQL
- System Tables
mysql- INFORMATION_SCHEMA
- Overview
ANALYZE_STATUSCLIENT_ERRORS_SUMMARY_BY_HOSTCLIENT_ERRORS_SUMMARY_BY_USERCLIENT_ERRORS_SUMMARY_GLOBALCHARACTER_SETSCLUSTER_CONFIGCLUSTER_HARDWARECLUSTER_INFOCLUSTER_LOADCLUSTER_LOGCLUSTER_SYSTEMINFOCOLLATIONSCOLLATION_CHARACTER_SET_APPLICABILITYCOLUMNSDATA_LOCK_WAITSDDL_JOBSDEADLOCKSENGINESINSPECTION_RESULTINSPECTION_RULESINSPECTION_SUMMARYKEY_COLUMN_USAGEMETRICS_SUMMARYMETRICS_TABLESPARTITIONSPLACEMENT_POLICIESPROCESSLISTREFERENTIAL_CONSTRAINTSSCHEMATASEQUENCESSESSION_VARIABLESSLOW_QUERYSTATISTICSTABLESTABLE_CONSTRAINTSTABLE_STORAGE_STATSTIDB_HOT_REGIONSTIDB_HOT_REGIONS_HISTORYTIDB_INDEXESTIDB_SERVERS_INFOTIDB_TRXTIFLASH_REPLICATIKV_REGION_PEERSTIKV_REGION_STATUSTIKV_STORE_STATUSUSER_PRIVILEGESVARIABLES_INFOVIEWS
METRICS_SCHEMA
- UI
- TiDB Dashboard
- Overview
- Maintain
- Access
- Overview Page
- Cluster Info Page
- Top SQL Page
- Key Visualizer Page
- Metrics Relation Graph
- SQL Statements Analysis
- Slow Queries Page
- Cluster Diagnostics
- Monitoring Page
- Search Logs Page
- Instance Profiling
- Session Management and Configuration
- FAQ
- CLI
- Command Line Flags
- Configuration File Parameters
- System Variables
- Storage Engines
- Telemetry
- Errors Codes
- Table Filter
- Schedule Replicas by Topology Labels
- FAQs
- Release Notes
- All Releases
- Release Timeline
- TiDB Versioning
- TiDB Installation Packages
- v6.2
- v6.1
- v6.0
- v5.4
- v5.3
- v5.2
- v5.1
- v5.0
- v4.0
- v3.1
- v3.0
- v2.1
- v2.0
- v1.0
- Glossary
TiDB Dashboard Diagnostic Report
This document introduces the content of the diagnostic report and viewing tips. To access the cluster diagnostic page and generate reports, see TiDB Dashboard Cluster Diagnostics Page.
View report
The diagnostic report consists of the following parts:
- Basic information: Includes the time range of the diagnostic report, hardware information of the cluster, the version information of cluster topology.
- Diagnostic information: Shows the results of automatic diagnostics.
- Load information: Includes CPU, memory and other load information of the server, TiDB, PD, or TiKV.
- Overview information: Includes the consumed time and error information of each TiDB, PD, or TiKV module.
- TiDB/PD/TiKV monitoring information: Includes monitoring information of each component.
- Configuration information: Includes configuration information of each component.
An example of the diagnostic report is as follows:
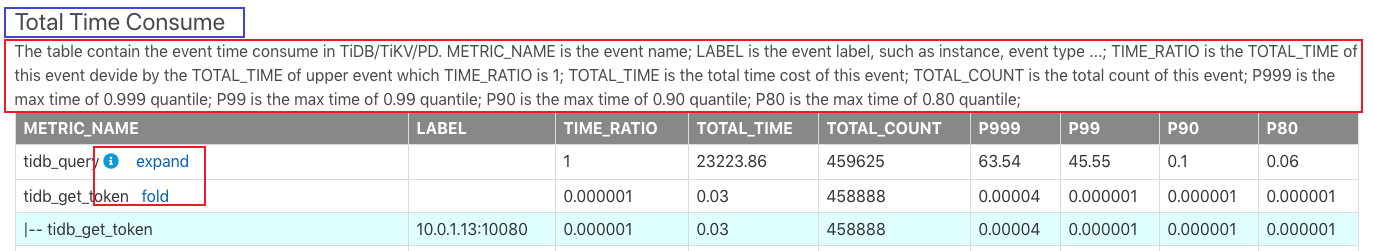
In the image above, Total Time Consume in the top blue box is the report name. The information in the red box below explains the content of this report and the meaning of each field in the report.
In this report, some small buttons are described as follows:
- i icon: You can move your mouse to the i icon to see the explanatory note of the row.
- expand: Click expand to see details about this monitoring metric. For example, the detailed information of
tidb_get_tokenin the image above includes the monitoring information of each TiDB instance's latency. - collapse: Contrary to expand, the button is used to fold detailed monitoring information.
All monitoring metrics basically correspond to those on the TiDB Grafana monitoring dashboard. After a module is found to be abnormal, you can view more monitoring information on the TiDB Grafana.
In addition, the TOTAL_TIME and TOTAL_COUNT metrics in this report are monitoring data read from Prometheus, so calculation inaccuracy might exits in their statistics.
Each part of this report is introduced as follows.
Basic information
Diagnostics Time Range
The time range for generating the diagnostics report includes the start time and end time.

Cluster Hardware Info
Cluster Hardware Info includes information such as CPU, memory, and disk of each server in the cluster.
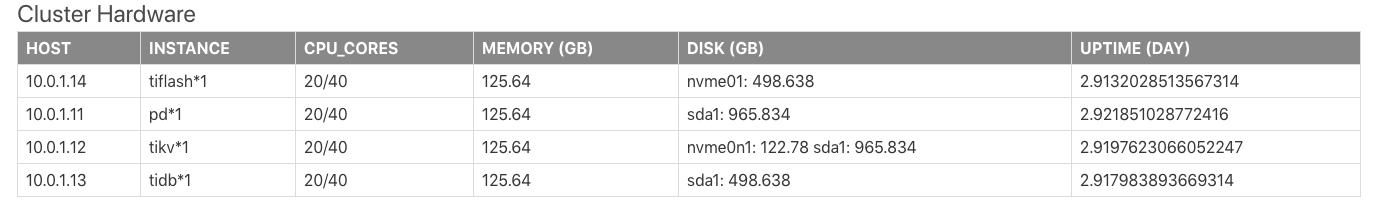
The fields in the table above are described as follows:
HOST: The IP address of the server.INSTANCE: The number of instances deployed on the server. For example,pd * 1means that this server has 1 PD instance deployed;tidb * 2 pd * 1means that this server has 2 TiDB instances and 1 PD instance deployed.CPU_CORES: Indicates the number of CPU cores (physical cores or logical cores) of the server.MEMORY: Indicates the memory size of the server. The unit is GB.DISK: Indicates the server disk size. The unit is GB.UPTIME: The uptime of the server. The unit is day.
Cluster Topology Info
The Cluster Info table shows the cluster topology information. The information in this table are from TiDB information_schema.cluster_info system table.
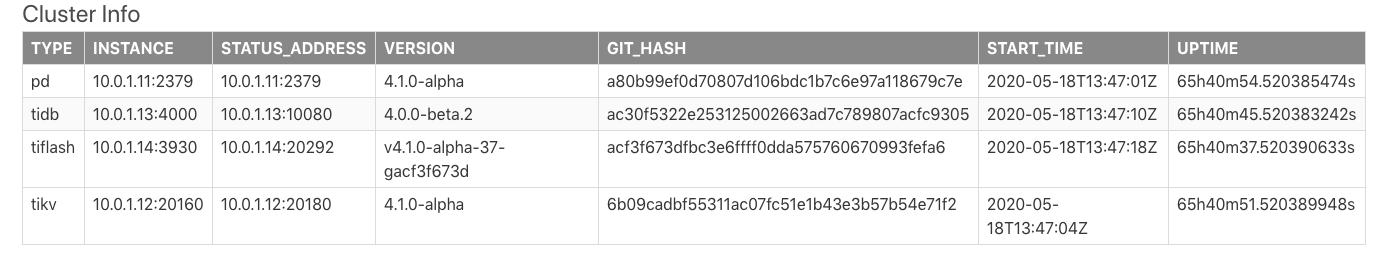
The fields in the table above are described as follows:
TYPE: The node type.INSTANCE: The instance address(es), which is a string in theIP:PORTformat.STATUS_ADDRESS: The HTTP API service address.VERSION: The semantic version number of the corresponding node.GIT_HASH: Git Commit Hash when compiling the node version, which is used to identify whether the two nodes are absolutely the consistent version.START_TIME: The start time of the corresponding node.UPTIME: The uptime of the corresponding node.
Diagnostic information
TiDB has built-in automatic diagnostic results. For the description of each field, see information_schema.inspection-result system table.
Load Info
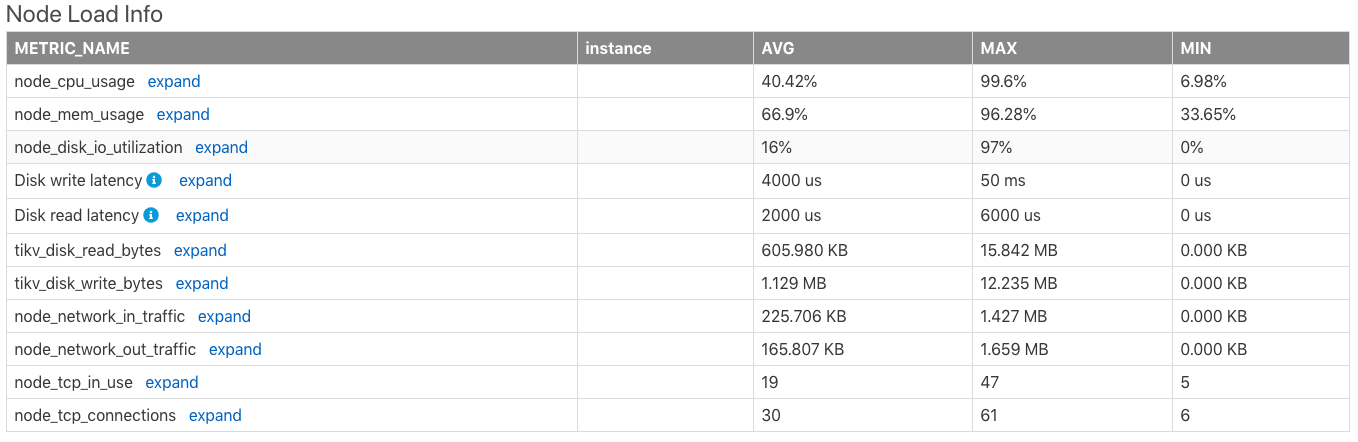
Node Load Info
The Node Load Info table shows the load information of the server node, including the average value (AVG), maximum value (MAX), minimum value (MIN) of the following metrics of the server within the time range:
- CPU usage (the maximum value is
100%) - Memory usage
- Disk I/O usage
- Disk write latency
- Disk read latency
- Disk read bytes per second
- Disk write bytes per second
- The number of bytes received by the node network per minute
- The number of bytes sent from the node network per minute
- The number of TCP connections in use by the node
- The number of all TCP connections of the node
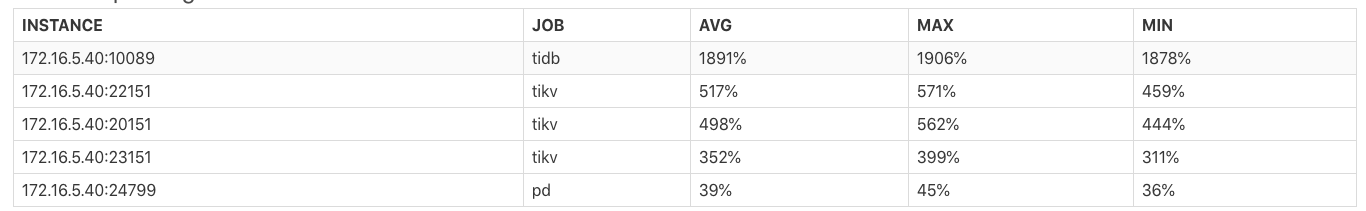
Instance CPU Usage
The Instance CPU Usage table shows the average value (AVG), maximum value (MAX), and minimum value (MIN) of the CPU usage of each TiDB/PD/TiKV process. The maximum CPU usage of the process is 100% * the number of CPU logical cores.
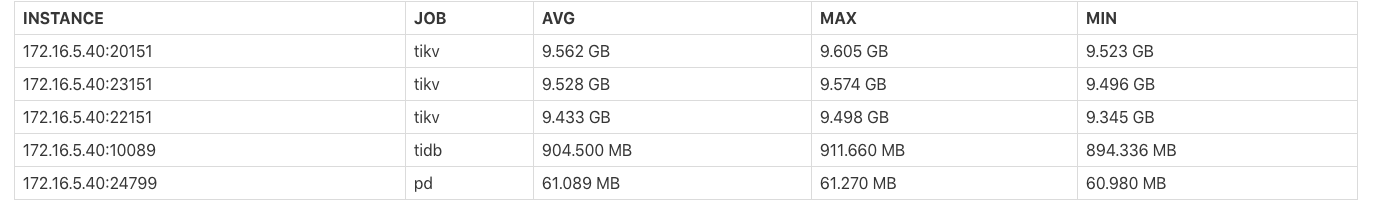
Instance Memory Usage
The Instance Memory Usage table shows the average value (AVG), maximum value (MAX), and minimum value (MIN) of memory bytes occupied by each TiDB/PD/TiKV process.
TiKV Thread CPU Usage
The TiKV Thread CPU Usage table shows the average value (AVG), maximum value (MAX) and minimum value (MIN) of CPU usage of each module thread in TiKV. The maximum CPU usage of the process is 100% * the thread count of the corresponding configuration.
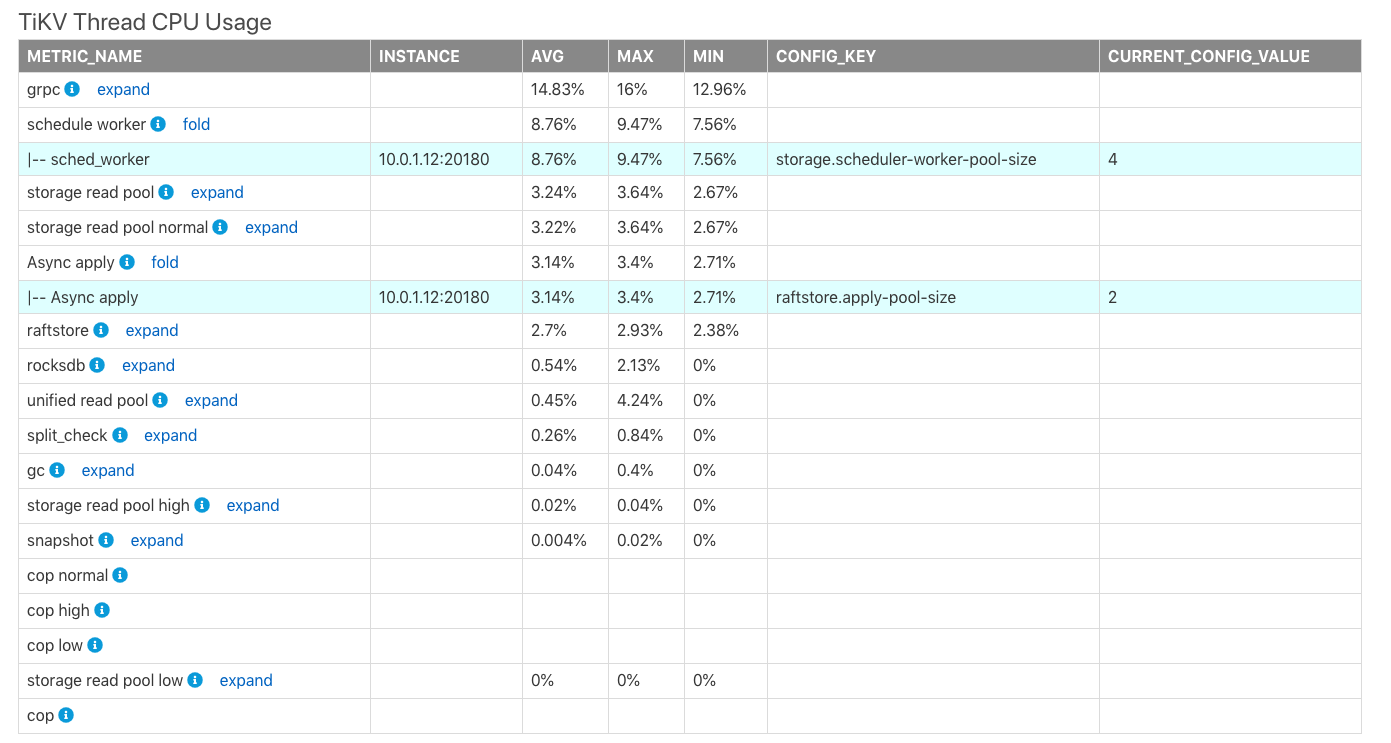
In the table above,
CONFIG_KEY: The relevant thread configuration of the corresponding module.CURRENT_CONFIG_VALUE: The current value of the configuration when the report is generated.
CURRENT_CONFIG_VALUE is the value when the report is generated, not the value within the time range of this report. Currently, some configuration values of historical time cannot be obtained.
TiDB/PD Goroutines Count
The TiDB/PD Goroutines Count table shows the average value (AVG), maximum value (MAX), and minimum value (MIN) of the number of TiDB or PD goroutines. If the number of goroutines exceeds 2,000, the concurrency of the process is too high, which affects the overall request latency.

Overview information
Time Consumed by Each Component
The Time Consumed by Each Component table shows the monitored consumed time and the time ratio of TiDB, PD, TiKV modules in the cluster. The default time unit is seconds. You can use this table to quickly locate which modules consume more time.
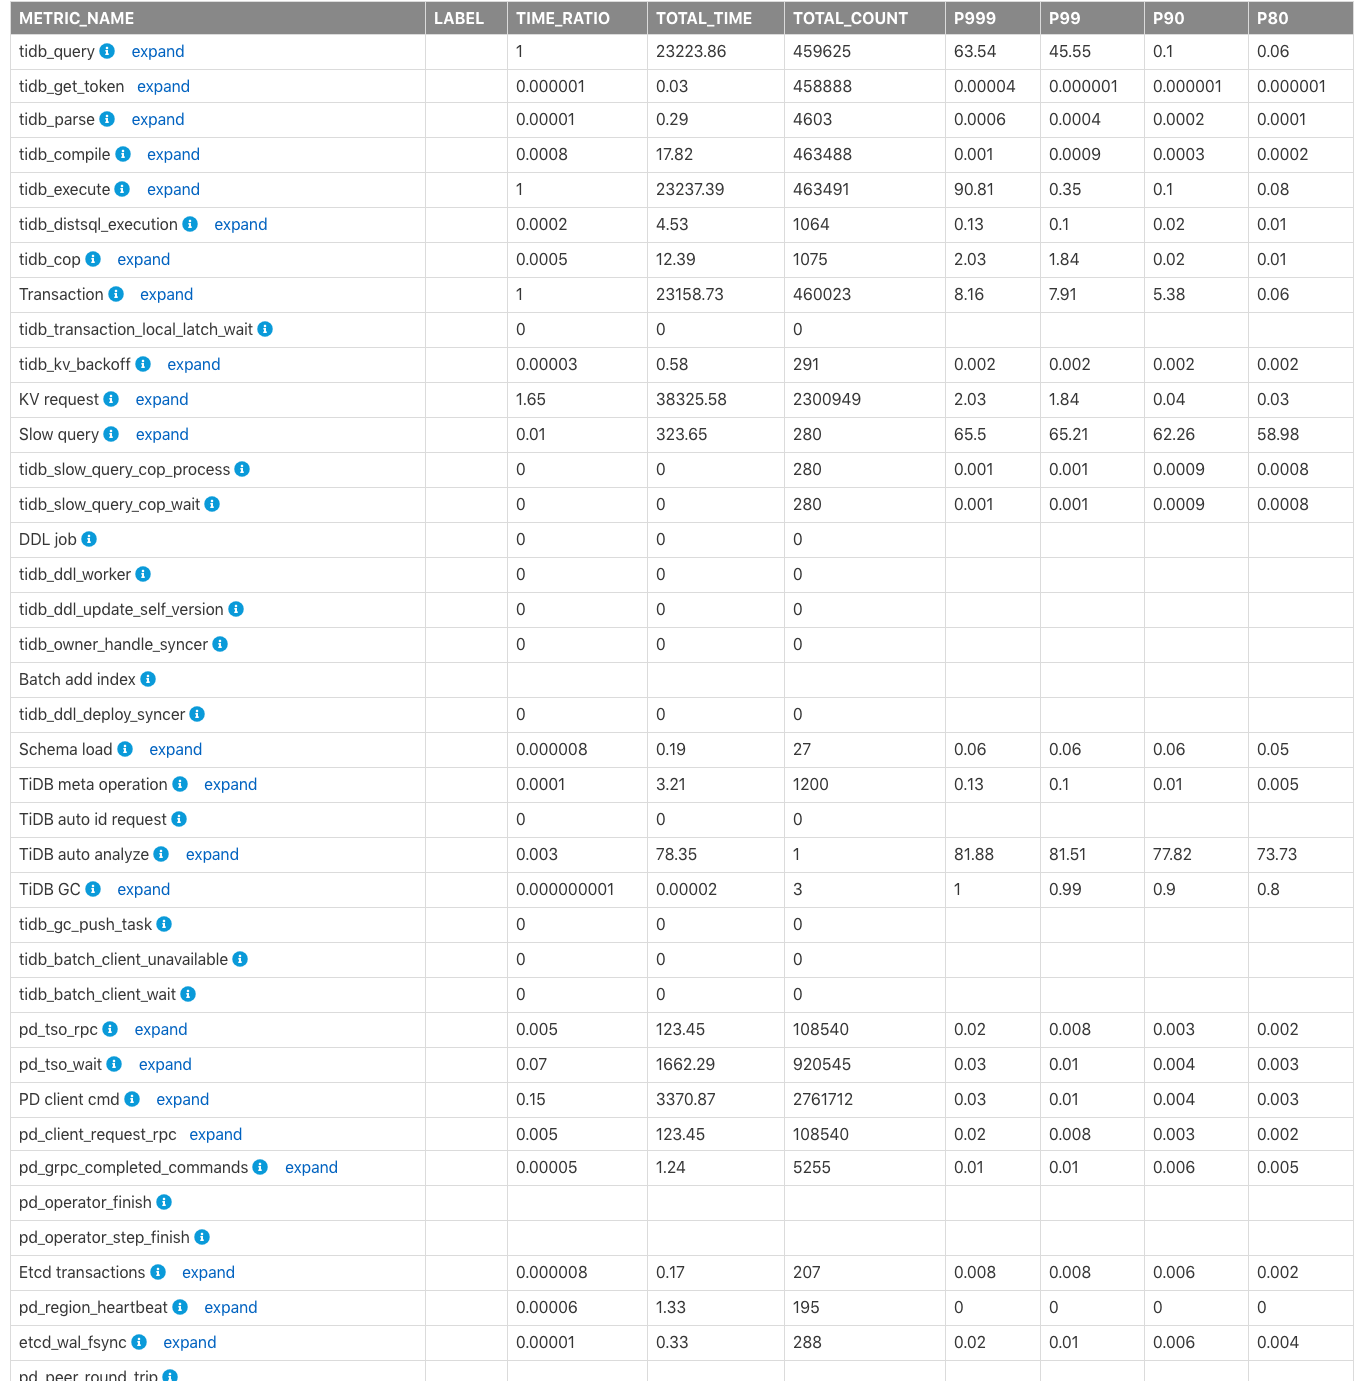
The fields in columns of the table above are described as follows:
METRIC_NAME: The name of the monitoring metric.Label: The label information for the monitoring metric. Click expand to view more detailed monitoring information of each label for a metric.TIME_RATIO: The ratio of the total time consumed by this monitoring metric to the total time of the monitoring row whereTIME_RATIOis1. For example, the total consumed time bykv_requestis1.65(namely,38325.58/23223.86) times that oftidb_query. Because KV requests are executed concurrently, the total time of all KV requests might exceed the total query (tidb_query) execution time.TOTAL_TIME: The total time consumed by this monitoring metric.TOTAL_COUNT: The total number of times this monitoring metric is executed.P999: The maximum P999 time of this monitoring metric.P99: The maximum P99 time of this monitoring metric.P90: The maximum P90 time of this monitoring metric.P80: The maximum P80 time of this monitoring metric.
The following image shows the relationship of time consumption of the related modules in the monitoring metrics above.
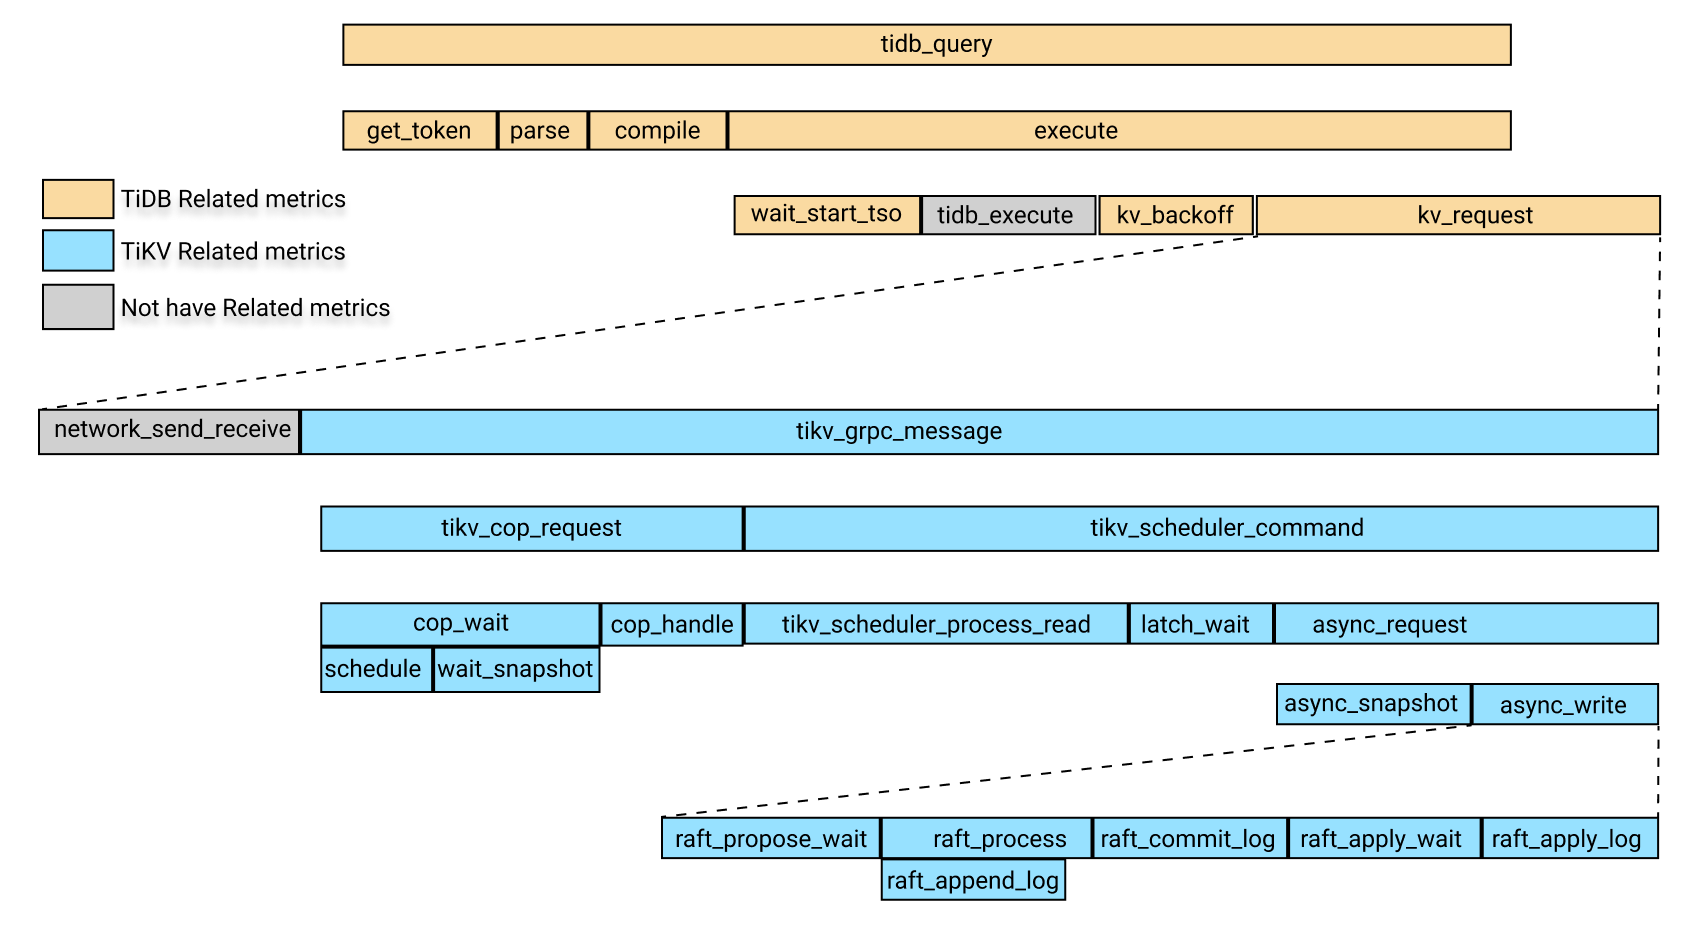
In the image above, yellow boxes are the TiDB-related monitoring metrics.Blue boxes are TiKV-related monitoring metrics, and gray boxes temporarily do not correspond to specific monitoring metrics.
In the image above, the time consumption of tidb_query includes the following four parts:
get_tokenparsecompileexecute
The execute time includes the following parts:
wait_start_tso- The execution time at the TiDB layer, which is currently not monitored
- KV request time
KV_backofftime, which is the time for backoff after the KV request fails
Among the parts above, the KV request time includes the following parts:
- The time consumed by the network sending and receiving of requests. Currently, there is no monitoring metric for this item. You can subtract the time of
tikv_grpc_messagefrom the KV request time to roughly estimate this item. tikv_grpc_messagetime consumption.
Among the parts above, tikv_grpc_message time consumption includes the following parts:
Coprocessor request time consumption, which refers to processing the COP type requests. This time consumption includes the following parts:
tikv_cop_wait: The time consumed by request queue.Coprocessor handle: The time consumed to process Coprocessor requests.
tikv_scheduler_commandtime consumption, which includes the following parts:tikv_scheduler_processing_read: The time consumed to process read requests.- The time consumed to get snapshot in
tikv_storage_async_request(snapshot is the label for this monitoring metric). - Time consumed to process write requests. This time consumption includes the following parts:
tikv_scheduler_latch_wait: The time consumed to wait for latch.- The time consumption of writes in
tikv_storage_async_request(write is the label for this monitoring metric).
Among the above metrics, The time consumption of writes in tikv_storage_async_request refers to the time consumption of writing Raft KVs, including the following parts:
tikv_raft_propose_waittikv_raft_process, which mainly includestikv_raft_append_logtikv_raft_commit_logtikv_raft_apply_waittikv_raft_apply_log
You can use TOTAL_TIME, the P999 time, and the P99 time to determine which modules consume longer time according to the relationship between the time consumptions described above, and then look at the related monitoring metrics.
Because the Raft KVs writes might be processed in one batch, using TOTAL_TIME to measure the time consumed by each module is inapplicable to monitoring metrics related to Raft KV writes, specifically, tikv_raft_process, tikv_raft_append_log, tikv_raft_commit_log, tikv_raft_apply_wait, and tikv_raft_apply_log. In this situation, it is more reasonable to compare the time consumption of each module with the time of P999 and P99.
The reason is that if there are 10 asynchronous write requests, Raft KVs internally pack 10 requests into a batch execution, and the execution time is 1 second. Therefore, the execution time of each request is 1 second, and the total time of 10 requests is 10 seconds, but the total time for Raft KV processing is 1 second. If you use TOTAL_TIME to measure the consumed time, you might not understand where the remaining 9 seconds are spent. You can also see the difference between the monitoring metric of Raft KV and other previous monitoring metrics from the total number of requests (TOTAL_COUNT).
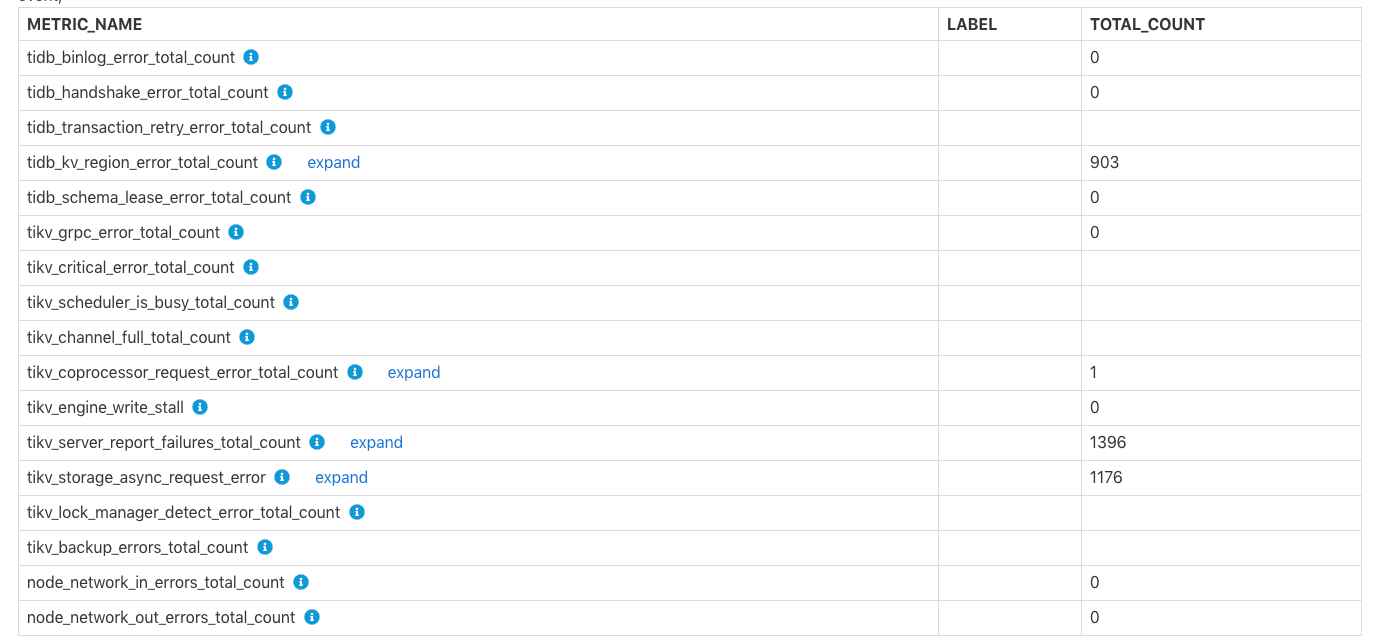
Errors Occurred in Each Component
The Errors Occurred in Each Component table shows the total number of errors in TiDB and TiKV, such as the failure to write binlog, tikv server is busy, TiKV channel full, tikv write stall. You can see the row comments for the specific meaning of each error.
Specific TiDB/PD/TiKV monitoring information
This part includes more specific monitoring information of TiDB, PD, or TiKV.
TiDB-related monitoring information
Time Consumed by TiDB Component
This table shows the time consumed by each TiDB module and the ratio of each time consumption, which is similar to the time consume table in the overview, but the label information of this table are more detailed.
TiDB Server Connections
This table shows the number of client connections for each TiDB instance.
TiDB Transaction
This table shows transaction-related monitoring metrics.
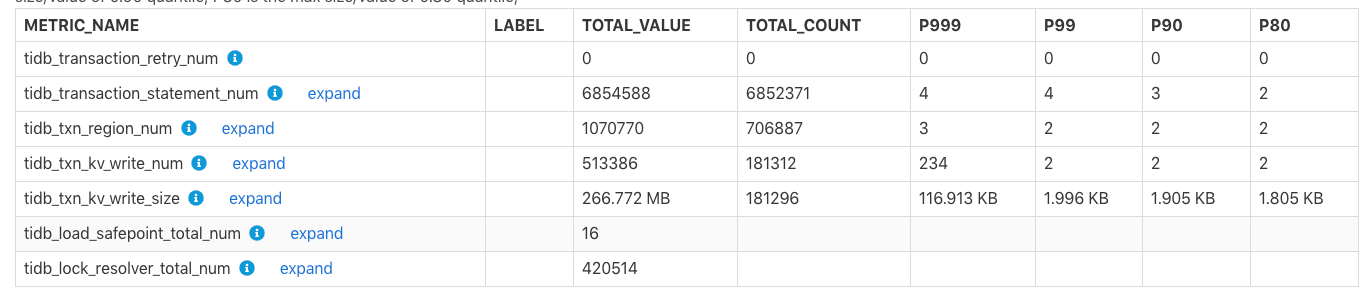
TOTAL_VALUE: The sum of all values (SUM) during the report time range.TOTAL_COUNT: The total number of occurrences of this monitoring metric.P999: The maximum P999 value of this monitoring metric.P99: The maximum P99 value of this monitoring metric.P90: The maximum P90 value of this monitoring metric.P80: The maximum P80 value of this monitoring metric.
Example:
In the table above, within the report time range, tidb_txn_kv_write_size: a total of about 181,296 transactions of KV writes, and the total KV write size is 266.772 MB, of which the maximum P999, P99, P90, P80 values for a single transaction of KV writes are 116.913 KB, 1.996 KB, 1.905 KB, and 1.805 KB.
DDL Owner
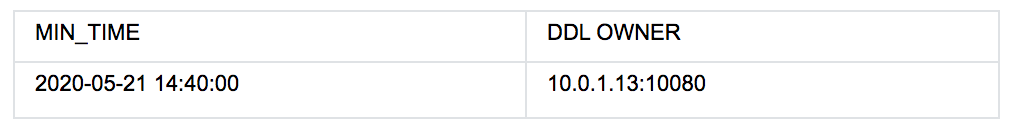
The table above shows that from 2020-05-21 14:40:00, the cluster's DDL OWNER is at the 10.0.1.13:10080 node. If the owner changes, multiple rows of data exist in the table above, where the Min_Time column indicates the minimum time of the corresponding known owner.
If the owner information is empty, it does not mean that no owner exists in this period of time. Because in this situation, the DDL owner is determined based on the monitoring information of ddl_worker, it might be that ddl_worker has not done any DDL job in this period of time, causing the owner information to be empty.
Other monitoring tables in TiDB are as follows:
- Statistics Info: Shows related monitoring metrics of TiDB statistical information.
- Top 10 Slow Query: Shows the Top 10 slow query information in the report time range.
- Top 10 Slow Query Group By Digest: Shows the Top 10 slow query information in the report time range, which is aggregated according to the SQL fingerprint.
- Slow Query With Diff Plan: The SQL statement whose execution plan changes within the report time range.
PD related monitoring information
The tables related to the monitoring information of PD modules are as follows:
Time Consumed by PD Component: The time consumed by the monitoring metrics of related modules in PD.Blance Leader/Region: The monitoring information ofbalance-regionandbalance leaderoccurred in the cluster within the report time range, such as the number of leaders that are scheduled out fromtikv_note_1or the number of leaders that are scheduled in.Cluster Status: The cluster status information, including total number of TiKV nodes, total cluster storage capacity, the number of Regions, and the number of offline TiKV nodes.Store Status: Record the status information of each TiKV node, including Region score, leader score, and the number of Regions/leaders.Etcd Status: etcd related information in PD.
TiKV related monitoring information
The tables related to the monitoring information of TiKV modules are as follows:
Time Consumed by TiKV Component: The time consumed by related modules in TiKV.Time Consumed by RocksDB: The time consumed by RocksDB in TiKV.TiKV Error: The error information related to each module in TiKV.TiKV Engine Size: The size of stored data of column families on each node in TiKV.Coprocessor Info: Monitoring information related to the Coprocessor module in TiKV.Raft Info: Monitoring information of the Raft module in TiKV.Snapshot Info: Snapshot related monitoring information in TiKV.GC Info: Garbage Collection (GC) related monitoring information in TiKV.Cache Hit: The hit rate information of each cache of RocksDB in TiKV.
Configuration information
In the configuration information, the configuration values of some modules are shown within the report time range. But the historical values of some other configurations of these modules cannot be obtained, so the shown values of these configurations are the current (when the report is generated) values .
Within the report time range, the following tables include items whose values are configured at the start time of the report time range:
Scheduler Initial Config: The initial value of PD scheduling-related configuration at the report's start time.TiDB GC Initial Config: The initial value of TiDB GC related-configuration at the report's start timeTiKV RocksDB Initial Config: The initial value of TiKV RocksDB-related configuration at the report's start timeTiKV RaftStore Initial Config: The initial value of TiKV RaftStore-related configuration at the report's start time
Within the report time range, if some configurations have been modified, the following tables include records of some configurations that have been modified:
Scheduler Config Change HistoryTiDB GC Config Change HistoryTiKV RocksDB Config Change HistoryTiKV RaftStore Config Change History
Example:

The table above shows that the leader-schedule-limit configuration parameter has been modified within the report time range:
2020-05-22T20:00:00+08:00: At the start time of the report, the configuration value ofleader-schedule-limitis4, which does not mean that the configuration has been modified, but that at the start time in the report time range, its configuration value is4.2020-05-22T20:07:00+08:00: Theleader-schedule-limitconfiguration value is8, which indicates that the value of this configuration has been modified around2020-05-22T20:07:00+08:00.
The following tables show the current configuration of TiDB, PD, and TiKV at the time when the report is generated:
TiDB's Current ConfigPD's Current ConfigTiKV's Current Config
Comparison report
You can generate a comparison report for two time ranges. The report content is the same as the report for a single time range, except that a comparison column is added to show the difference between the two time ranges. The following sections introduce some unique tables in the comparison report and how to view the comparison report.
First, the Compare Report Time Range report in the basic information shows the two time ranges for comparison:

In the table above, t1 is the normal time range, or the reference time range. t2 is the abnormal time range.
Tables related to slow queries are shown as follows:
Slow Queries In Time Range t2: Shows slow queries that only appear int2but not duringt1.Top 10 slow query in time range t1: The Top 10 slow queries duringt1.Top 10 slow query in time range t2: The Top 10 slow queries duringt2.
DIFF_RATIO introduction
This section introduces DIFF_RATIO using the Instance CPU Usage table as an example.
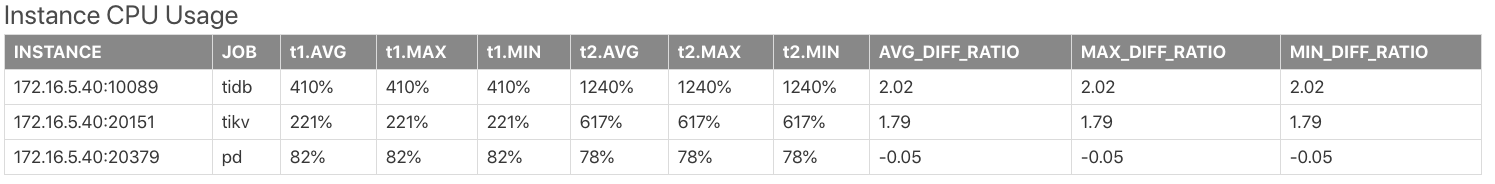
t1.AVG,t1.MAX,t1.Minare the average value, maximum value, and minimum value of CPU usage in thet1.t2.AVG,t2.MAX, andt2.Minare the average value, maximum value, and minimum value of CPU usage duringt2.AVG_DIFF_RATIOisDIFF_RATIOof the average values duringt1andt2.MAX_DIFF_RATIOisDIFF_RATIOof the maximum values duringt1andt2.MIN_DIFF_RATIOisDIFF_RATIOof the minimum values duringt1andt2.
DIFF_RATIO: Indicates the difference value between the two time ranges. It has the following values:
- If the monitoring metric has a value only within
t2and has no value withint1, the value ofDIFF_RATIOis1. - If the monitoring metric has a value only within
t1, and has no value withint2time range, the value ofDIFF_RATIOis-1. - If the value of
t2is greater than that oft1, thenDIFF_RATIO=(t2.value / t1.value)-1 - If the value of
t2is smaller than that oft1, thenDIFF_RATIO=1-(t1.value / t2.value)
For example, in the table above, the average CPU usage of the tidb node in t2 is 2.02 times higher than that in t1, which is 2.02 = 1240/410-1.
Maximum Different Item table
The Maximum Different Item table compares the monitoring metrics of two time ranges, and sorts them according to the difference of the monitoring metrics. Using this table, you can quickly find out which monitoring metric has the biggest difference in the two time ranges. See the following example:
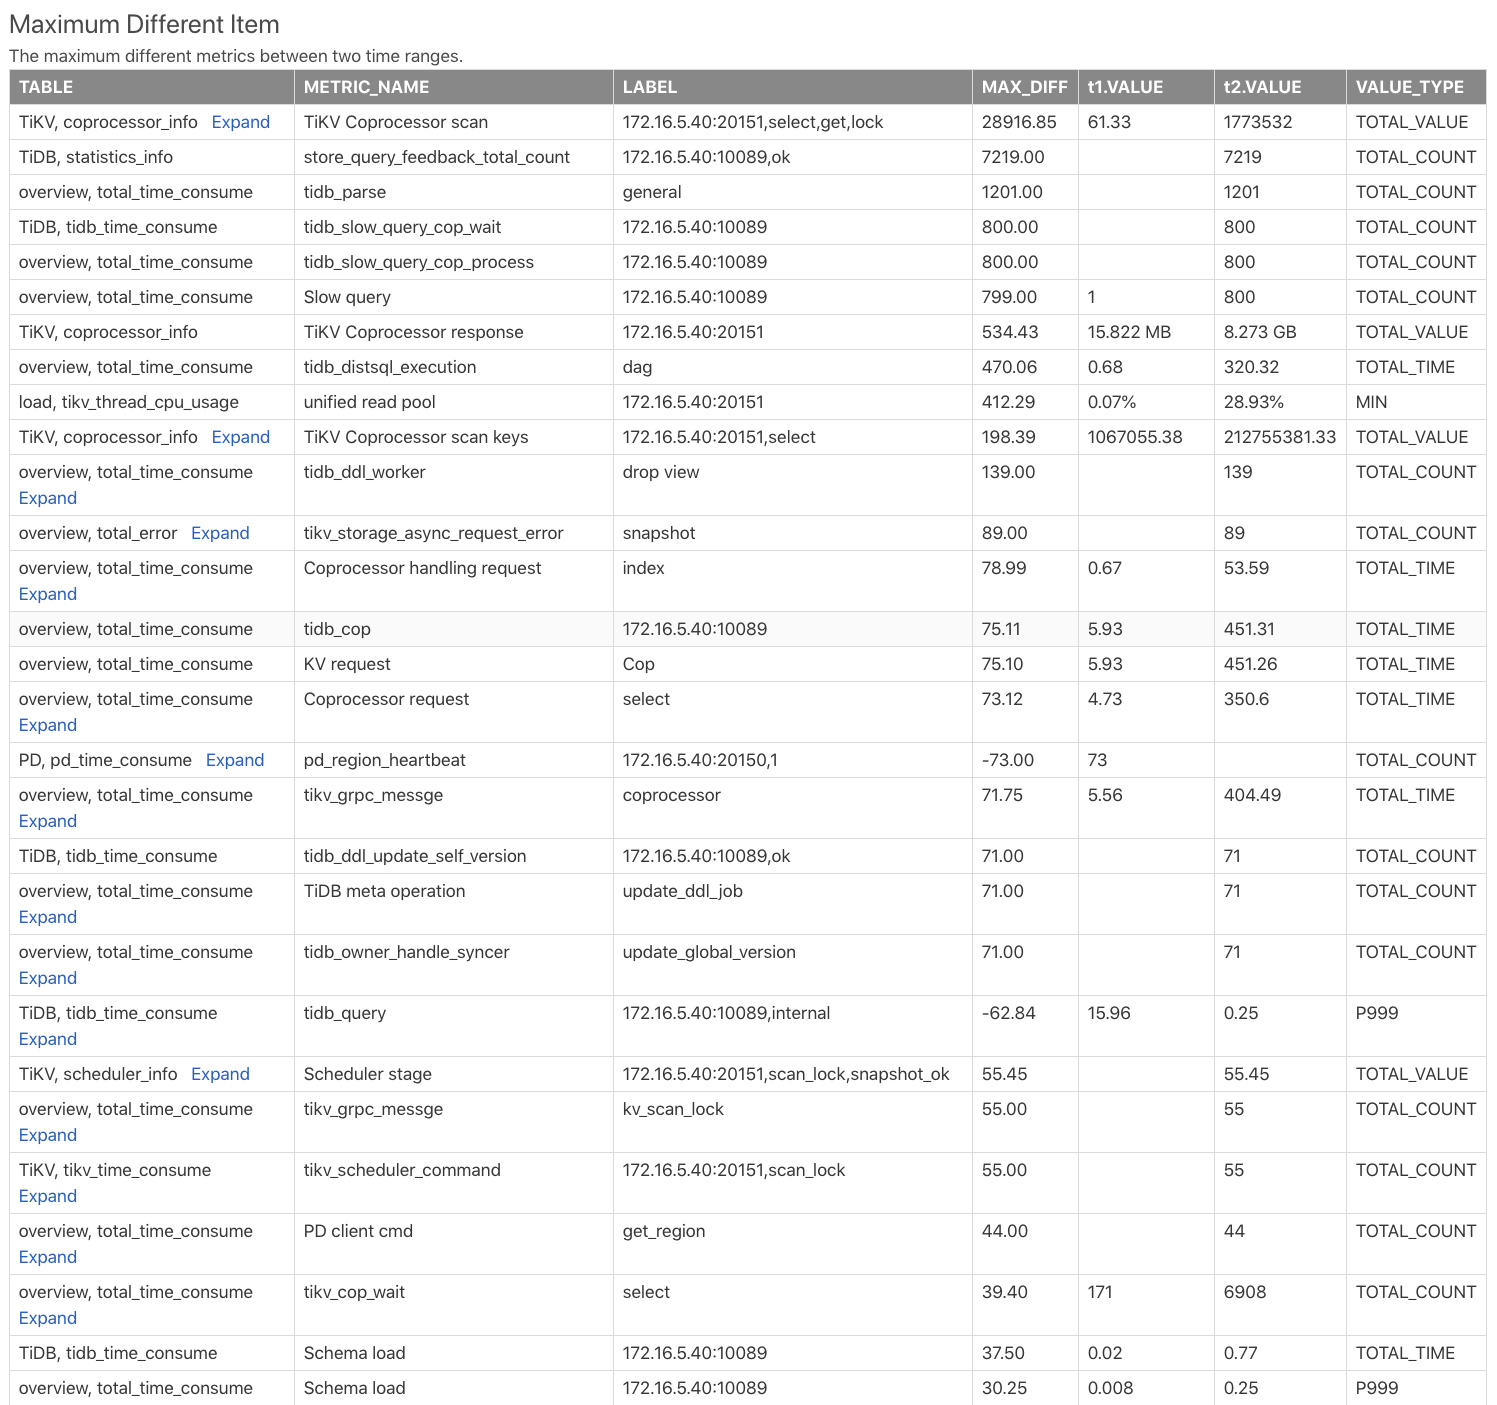
Table: Indicates this monitoring metric comes from which table in the comparison report. For example,TiKV, coprocessor_infoindicates thecoprocessor_infotable in the TiKV component.METRIC_NAME: The monitoring metric name. Clickexpandto view the comparison of different labels of metrics.LABEL: The label corresponding to the monitoring metric. For example, the monitoring metric ofTiKV Coprocessor scanhas 2 labels, namelyinstance,req,tag,sql_type, which are the TiKV address, request type, operation type and operation column family.MAX_DIFF: Difference value, which is theDIFF_RATIOcalculation oft1.VALUEandt2.VALUE.
From the table above, you can see the t2 time range has much more Coprocessor requests than the t1 time range, and the SQL parsing time of TiDB in t2 is much longer.