- Docs Home
- About TiDB
- Quick Start
- Develop
- Overview
- Quick Start
- Build a TiDB Cluster in TiDB Cloud (Developer Tier)
- CRUD SQL in TiDB
- Build a Simple CRUD App with TiDB
- Example Applications
- Connect to TiDB
- Design Database Schema
- Write Data
- Read Data
- Transaction
- Optimize
- Troubleshoot
- Reference
- Cloud Native Development Environment
- Third-party Support
- Deploy
- Software and Hardware Requirements
- Environment Configuration Checklist
- Plan Cluster Topology
- Install and Start
- Verify Cluster Status
- Test Cluster Performance
- Migrate
- Overview
- Migration Tools
- Migration Scenarios
- Migrate from Aurora
- Migrate MySQL of Small Datasets
- Migrate MySQL of Large Datasets
- Migrate and Merge MySQL Shards of Small Datasets
- Migrate and Merge MySQL Shards of Large Datasets
- Migrate from CSV Files
- Migrate from SQL Files
- Migrate from One TiDB Cluster to Another TiDB Cluster
- Migrate from TiDB to MySQL-compatible Databases
- Advanced Migration
- Integrate
- Overview
- Integration Scenarios
- Maintain
- Monitor and Alert
- Troubleshoot
- TiDB Troubleshooting Map
- Identify Slow Queries
- Analyze Slow Queries
- SQL Diagnostics
- Identify Expensive Queries Using Top SQL
- Identify Expensive Queries Using Logs
- Statement Summary Tables
- Troubleshoot Hotspot Issues
- Troubleshoot Increased Read and Write Latency
- Save and Restore the On-Site Information of a Cluster
- Troubleshoot Cluster Setup
- Troubleshoot High Disk I/O Usage
- Troubleshoot Lock Conflicts
- Troubleshoot TiFlash
- Troubleshoot Write Conflicts in Optimistic Transactions
- Troubleshoot Inconsistency Between Data and Indexes
- Performance Tuning
- Tuning Guide
- Configuration Tuning
- System Tuning
- Software Tuning
- SQL Tuning
- Overview
- Understanding the Query Execution Plan
- SQL Optimization Process
- Overview
- Logic Optimization
- Physical Optimization
- Prepare Execution Plan Cache
- Control Execution Plans
- Tutorials
- TiDB Tools
- Overview
- Use Cases
- Download
- TiUP
- Documentation Map
- Overview
- Terminology and Concepts
- Manage TiUP Components
- FAQ
- Troubleshooting Guide
- Command Reference
- Overview
- TiUP Commands
- TiUP Cluster Commands
- Overview
- tiup cluster audit
- tiup cluster check
- tiup cluster clean
- tiup cluster deploy
- tiup cluster destroy
- tiup cluster disable
- tiup cluster display
- tiup cluster edit-config
- tiup cluster enable
- tiup cluster help
- tiup cluster import
- tiup cluster list
- tiup cluster patch
- tiup cluster prune
- tiup cluster reload
- tiup cluster rename
- tiup cluster replay
- tiup cluster restart
- tiup cluster scale-in
- tiup cluster scale-out
- tiup cluster start
- tiup cluster stop
- tiup cluster template
- tiup cluster upgrade
- TiUP DM Commands
- Overview
- tiup dm audit
- tiup dm deploy
- tiup dm destroy
- tiup dm disable
- tiup dm display
- tiup dm edit-config
- tiup dm enable
- tiup dm help
- tiup dm import
- tiup dm list
- tiup dm patch
- tiup dm prune
- tiup dm reload
- tiup dm replay
- tiup dm restart
- tiup dm scale-in
- tiup dm scale-out
- tiup dm start
- tiup dm stop
- tiup dm template
- tiup dm upgrade
- TiDB Cluster Topology Reference
- DM Cluster Topology Reference
- Mirror Reference Guide
- TiUP Components
- PingCAP Clinic Diagnostic Service
- TiDB Operator
- Dumpling
- TiDB Lightning
- TiDB Data Migration
- About TiDB Data Migration
- Architecture
- Quick Start
- Deploy a DM cluster
- Tutorials
- Advanced Tutorials
- Maintain
- Cluster Upgrade
- Tools
- Performance Tuning
- Manage Data Sources
- Manage Tasks
- Export and Import Data Sources and Task Configurations of Clusters
- Handle Alerts
- Daily Check
- Reference
- Architecture
- Command Line
- Configuration Files
- OpenAPI
- Compatibility Catalog
- Secure
- Monitoring and Alerts
- Error Codes
- Glossary
- Example
- Troubleshoot
- Release Notes
- Backup & Restore (BR)
- Point-in-Time Recovery
- TiDB Binlog
- TiCDC
- Dumpling
- sync-diff-inspector
- TiSpark
- Reference
- Cluster Architecture
- Key Monitoring Metrics
- Secure
- Privileges
- SQL
- SQL Language Structure and Syntax
- SQL Statements
ADD COLUMNADD INDEXADMINADMIN CANCEL DDLADMIN CHECKSUM TABLEADMIN CHECK [TABLE|INDEX]ADMIN SHOW DDL [JOBS|QUERIES]ADMIN SHOW TELEMETRYALTER DATABASEALTER INDEXALTER INSTANCEALTER PLACEMENT POLICYALTER TABLEALTER TABLE COMPACTALTER TABLE SET TIFLASH MODEALTER USERANALYZE TABLEBACKUPBATCHBEGINCHANGE COLUMNCOMMITCHANGE DRAINERCHANGE PUMPCREATE [GLOBAL|SESSION] BINDINGCREATE DATABASECREATE INDEXCREATE PLACEMENT POLICYCREATE ROLECREATE SEQUENCECREATE TABLE LIKECREATE TABLECREATE USERCREATE VIEWDEALLOCATEDELETEDESCDESCRIBEDODROP [GLOBAL|SESSION] BINDINGDROP COLUMNDROP DATABASEDROP INDEXDROP PLACEMENT POLICYDROP ROLEDROP SEQUENCEDROP STATSDROP TABLEDROP USERDROP VIEWEXECUTEEXPLAIN ANALYZEEXPLAINFLASHBACK TABLEFLUSH PRIVILEGESFLUSH STATUSFLUSH TABLESGRANT <privileges>GRANT <role>INSERTKILL [TIDB]LOAD DATALOAD STATSMODIFY COLUMNPREPARERECOVER TABLERENAME INDEXRENAME TABLEREPLACERESTOREREVOKE <privileges>REVOKE <role>ROLLBACKSAVEPOINTSELECTSET DEFAULT ROLESET [NAMES|CHARACTER SET]SET PASSWORDSET ROLESET TRANSACTIONSET [GLOBAL|SESSION] <variable>SHOW ANALYZE STATUSSHOW [BACKUPS|RESTORES]SHOW [GLOBAL|SESSION] BINDINGSSHOW BUILTINSSHOW CHARACTER SETSHOW COLLATIONSHOW [FULL] COLUMNS FROMSHOW CONFIGSHOW CREATE PLACEMENT POLICYSHOW CREATE SEQUENCESHOW CREATE TABLESHOW CREATE USERSHOW DATABASESSHOW DRAINER STATUSSHOW ENGINESSHOW ERRORSSHOW [FULL] FIELDS FROMSHOW GRANTSSHOW INDEX [FROM|IN]SHOW INDEXES [FROM|IN]SHOW KEYS [FROM|IN]SHOW MASTER STATUSSHOW PLACEMENTSHOW PLACEMENT FORSHOW PLACEMENT LABELSSHOW PLUGINSSHOW PRIVILEGESSHOW [FULL] PROCESSSLISTSHOW PROFILESSHOW PUMP STATUSSHOW SCHEMASSHOW STATS_HEALTHYSHOW STATS_HISTOGRAMSSHOW STATS_METASHOW STATUSSHOW TABLE NEXT_ROW_IDSHOW TABLE REGIONSSHOW TABLE STATUSSHOW [FULL] TABLESSHOW [GLOBAL|SESSION] VARIABLESSHOW WARNINGSSHUTDOWNSPLIT REGIONSTART TRANSACTIONTABLETRACETRUNCATEUPDATEUSEWITH
- Data Types
- Functions and Operators
- Overview
- Type Conversion in Expression Evaluation
- Operators
- Control Flow Functions
- String Functions
- Numeric Functions and Operators
- Date and Time Functions
- Bit Functions and Operators
- Cast Functions and Operators
- Encryption and Compression Functions
- Locking Functions
- Information Functions
- JSON Functions
- Aggregate (GROUP BY) Functions
- Window Functions
- Miscellaneous Functions
- Precision Math
- Set Operations
- List of Expressions for Pushdown
- TiDB Specific Functions
- Clustered Indexes
- Constraints
- Generated Columns
- SQL Mode
- Table Attributes
- Transactions
- Garbage Collection (GC)
- Views
- Partitioning
- Temporary Tables
- Cached Tables
- Character Set and Collation
- Placement Rules in SQL
- System Tables
mysql- INFORMATION_SCHEMA
- Overview
ANALYZE_STATUSCLIENT_ERRORS_SUMMARY_BY_HOSTCLIENT_ERRORS_SUMMARY_BY_USERCLIENT_ERRORS_SUMMARY_GLOBALCHARACTER_SETSCLUSTER_CONFIGCLUSTER_HARDWARECLUSTER_INFOCLUSTER_LOADCLUSTER_LOGCLUSTER_SYSTEMINFOCOLLATIONSCOLLATION_CHARACTER_SET_APPLICABILITYCOLUMNSDATA_LOCK_WAITSDDL_JOBSDEADLOCKSENGINESINSPECTION_RESULTINSPECTION_RULESINSPECTION_SUMMARYKEY_COLUMN_USAGEMETRICS_SUMMARYMETRICS_TABLESPARTITIONSPLACEMENT_POLICIESPROCESSLISTREFERENTIAL_CONSTRAINTSSCHEMATASEQUENCESSESSION_VARIABLESSLOW_QUERYSTATISTICSTABLESTABLE_CONSTRAINTSTABLE_STORAGE_STATSTIDB_HOT_REGIONSTIDB_HOT_REGIONS_HISTORYTIDB_INDEXESTIDB_SERVERS_INFOTIDB_TRXTIFLASH_REPLICATIKV_REGION_PEERSTIKV_REGION_STATUSTIKV_STORE_STATUSUSER_PRIVILEGESVARIABLES_INFOVIEWS
METRICS_SCHEMA
- UI
- TiDB Dashboard
- Overview
- Maintain
- Access
- Overview Page
- Cluster Info Page
- Top SQL Page
- Key Visualizer Page
- Metrics Relation Graph
- SQL Statements Analysis
- Slow Queries Page
- Cluster Diagnostics
- Monitoring Page
- Search Logs Page
- Instance Profiling
- Session Management and Configuration
- FAQ
- CLI
- Command Line Flags
- Configuration File Parameters
- System Variables
- Storage Engines
- Telemetry
- Errors Codes
- Table Filter
- Schedule Replicas by Topology Labels
- FAQs
- Release Notes
- All Releases
- Release Timeline
- TiDB Versioning
- TiDB Installation Packages
- v6.2
- v6.1
- v6.0
- v5.4
- v5.3
- v5.2
- v5.1
- v5.0
- v4.0
- v3.1
- v3.0
- v2.1
- v2.0
- v1.0
- Glossary
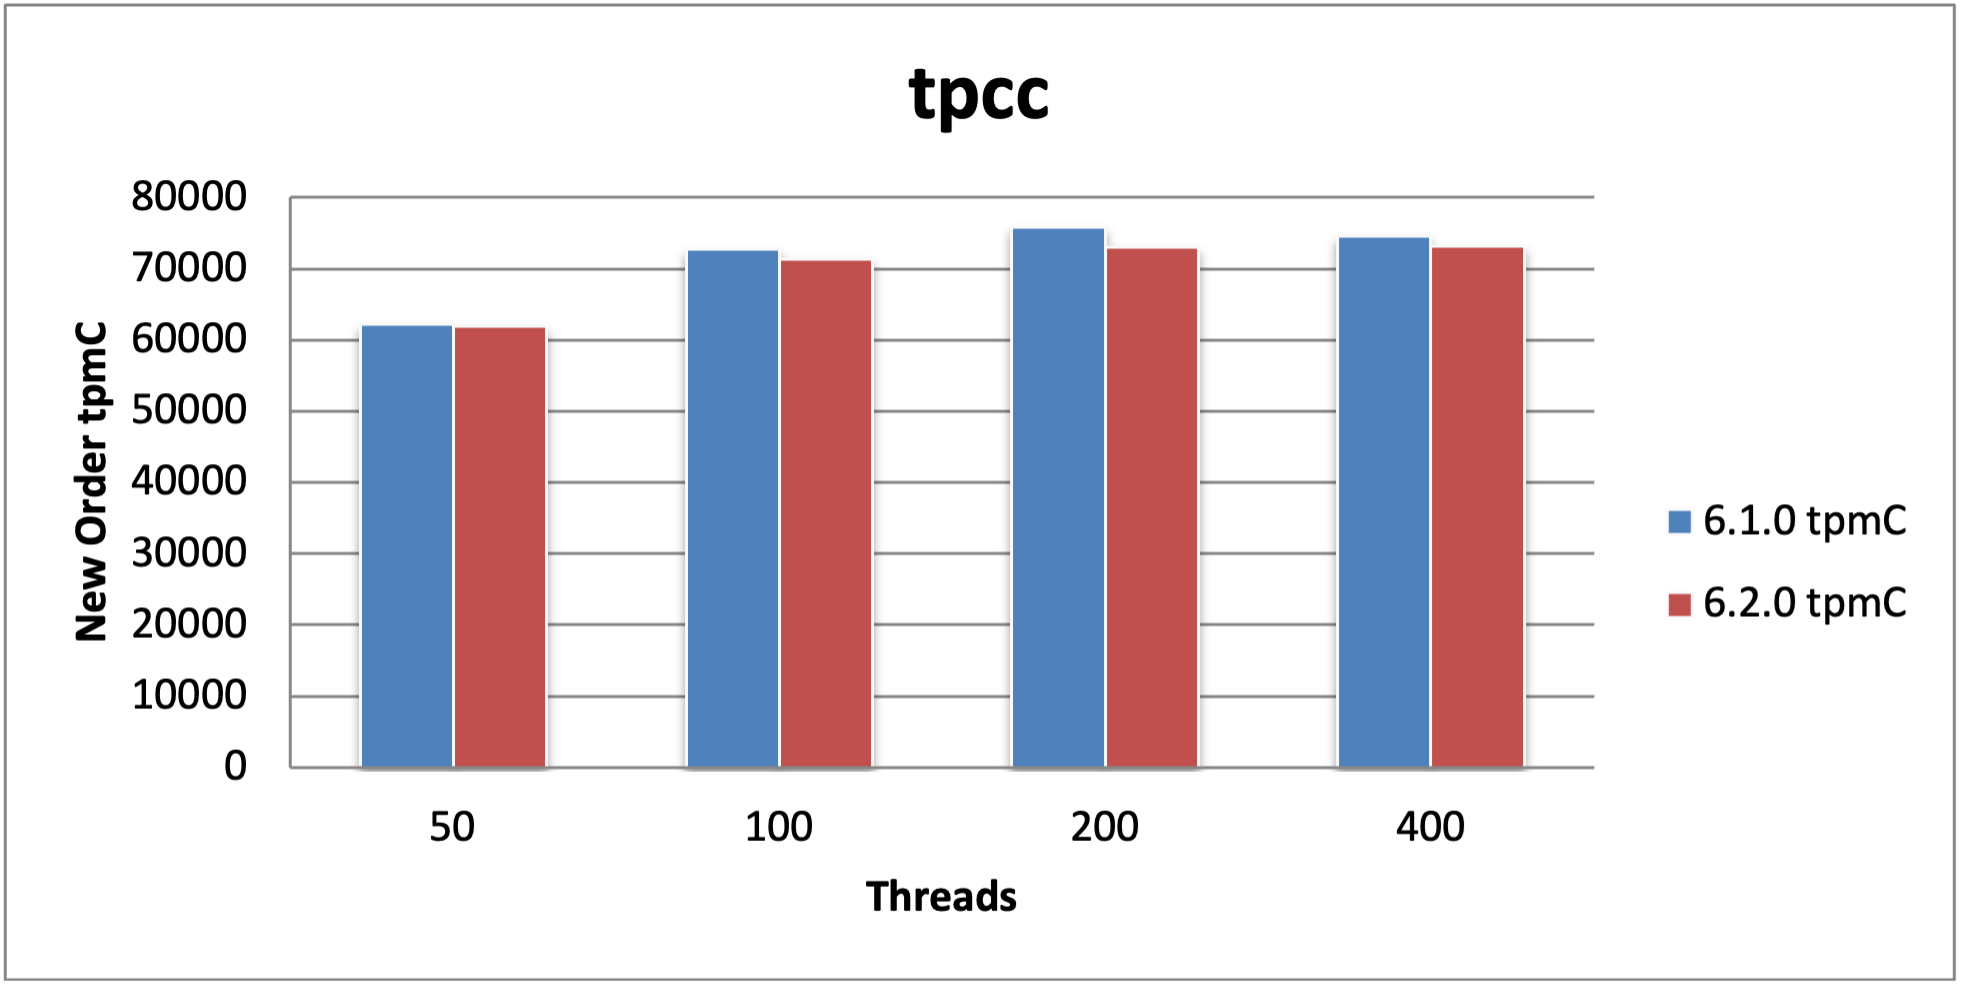
TiDB TPC-C Performance Test Report -- v6.2.0 vs. v6.1.0
Test overview
This test aims at comparing the TPC-C performance of TiDB v6.2.0 and v6.1.0 in the Online Transactional Processing (OLTP) scenario. The results show that compared with v6.1.0, the TPC-C performance of v6.2.0 is declined by 2.00%.
Test environment (AWS EC2)
Hardware configuration
| Service type | EC2 type | Instance count |
|---|---|---|
| PD | m5.xlarge | 3 |
| TiKV | i3.4xlarge | 3 |
| TiDB | c5.4xlarge | 3 |
| TPC-C | c5.9xlarge | 1 |
Software version
| Service type | Software version |
|---|---|
| PD | v6.1.0 and v6.2.0 |
| TiDB | v6.1.0 and v6.2.0 |
| TiKV | v6.1.0 and v6.2.0 |
| TiUP | 1.9.3 |
| HAProxy | 2.5.0 |
Parameter configuration
TiDB v6.2.0 and TiDB v6.1.0 use the same configuration.
TiDB parameter configuration
log.level: "error"
prepared-plan-cache.enabled: true
tikv-client.max-batch-wait-time: 2000000
TiKV parameter configuration
raftstore.apply-max-batch-size: 2048
raftstore.apply-pool-size: 3
raftstore.store-max-batch-size: 2048
raftstore.store-pool-size: 2
readpool.storage.normal-concurrency: 10
server.grpc-concurrency: 6
TiDB global variable configuration
set global tidb_hashagg_final_concurrency=1;
set global tidb_hashagg_partial_concurrency=1;
set global tidb_enable_async_commit = 1;
set global tidb_enable_1pc = 1;
set global tidb_guarantee_linearizability = 0;
set global tidb_enable_clustered_index = 1;
set global tidb_prepared_plan_cache_size=1000;
HAProxy configuration - haproxy.cfg
For more details about how to use HAProxy on TiDB, see Best Practices for Using HAProxy in TiDB.
global                                     # Global configuration.
   pidfile     /var/run/haproxy.pid        # Writes the PIDs of HAProxy processes into this file.
   maxconn     4000                        # The maximum number of concurrent connections for a single HAProxy process.
   user        haproxy                     # The same with the UID parameter.
   group       haproxy                     # The same with the GID parameter. A dedicated user group is recommended.
   nbproc      64                          # The number of processes created when going daemon. When starting multiple processes to forward requests, ensure that the value is large enough so that HAProxy does not block processes.
   daemon                                  # Makes the process fork into background. It is equivalent to the command line "-D" argument. It can be disabled by the command line "-db" argument.

defaults                                   # Default configuration.
   log global                              # Inherits the settings of the global configuration.
   retries 2                               # The maximum number of retries to connect to an upstream server. If the number of connection attempts exceeds the value, the backend server is considered unavailable.
   timeout connect  2s                     # The maximum time to wait for a connection attempt to a backend server to succeed. It should be set to a shorter time if the server is located on the same LAN as HAProxy.
   timeout client 30000s                   # The maximum inactivity time on the client side.
   timeout server 30000s                   # The maximum inactivity time on the server side.

listen tidb-cluster                        # Database load balancing.
   bind 0.0.0.0:3390                       # The Floating IP address and listening port.
   mode tcp                                # HAProxy uses layer 4, the transport layer.
   balance leastconn                      # The server with the fewest connections receives the connection. "leastconn" is recommended where long sessions are expected, such as LDAP, SQL and TSE, rather than protocols using short sessions, such as HTTP. The algorithm is dynamic, which means that server weights might be adjusted on the fly for slow starts for instance.
   server tidb-1 10.9.18.229:4000 check inter 2000 rise 2 fall 3       # Detects port 4000 at a frequency of once every 2000 milliseconds. If it is detected as successful twice, the server is considered available; if it is detected as failed three times, the server is considered unavailable.
   server tidb-2 10.9.39.208:4000 check inter 2000 rise 2 fall 3
   server tidb-3 10.9.64.166:4000 check inter 2000 rise 2 fall 3
Prepare test data
- Deploy TiDB v6.2.0 and v6.1.0 using TiUP.
- Create a database named
tpcc:create database tpcc;. - Use BenchmarkSQL to import the TPC-C 5000 Warehouse data:
tiup bench tpcc prepare --warehouse 5000 --db tpcc -H 127.0.0.1 -P 4000. - Run the
tiup bench tpcc run -U root --db tpcc --host 127.0.0.1 --port 4000 --time 1800s --warehouses 5000 --threads {{thread}}command to perform stress tests on TiDB via HAProxy. For each concurrency, the test takes 30 minutes. - Extract the tpmC data of New Order from the result.
Test result
Compared with v6.1.0, the TPC-C performance of v6.2.0 is declined by 2.00%.
| Threads | v6.1.0 tpmC | v6.2.0 tpmC | tpmC improvement (%) |
|---|---|---|---|
| 50 | 62212.4 | 61874.4 | -0.54 |
| 100 | 72790.7 | 71317.5 | -2.02 |
| 200 | 75818.6 | 73090.4 | -3.60 |
| 400 | 74515.3 | 73156.9 | -1.82 |
Was this page helpful?