- Docs Home
- About TiDB
- Quick Start
- Develop
- Overview
- Quick Start
- Build a TiDB Cluster in TiDB Cloud (Developer Tier)
- CRUD SQL in TiDB
- Build a Simple CRUD App with TiDB
- Example Applications
- Connect to TiDB
- Design Database Schema
- Write Data
- Read Data
- Transaction
- Optimize
- Troubleshoot
- Reference
- Cloud Native Development Environment
- Third-party Support
- Deploy
- Software and Hardware Requirements
- Environment Configuration Checklist
- Plan Cluster Topology
- Install and Start
- Verify Cluster Status
- Test Cluster Performance
- Migrate
- Overview
- Migration Tools
- Migration Scenarios
- Migrate from Aurora
- Migrate MySQL of Small Datasets
- Migrate MySQL of Large Datasets
- Migrate and Merge MySQL Shards of Small Datasets
- Migrate and Merge MySQL Shards of Large Datasets
- Migrate from CSV Files
- Migrate from SQL Files
- Migrate from One TiDB Cluster to Another TiDB Cluster
- Migrate from TiDB to MySQL-compatible Databases
- Advanced Migration
- Integrate
- Overview
- Integration Scenarios
- Maintain
- Monitor and Alert
- Troubleshoot
- TiDB Troubleshooting Map
- Identify Slow Queries
- Analyze Slow Queries
- SQL Diagnostics
- Identify Expensive Queries Using Top SQL
- Identify Expensive Queries Using Logs
- Statement Summary Tables
- Troubleshoot Hotspot Issues
- Troubleshoot Increased Read and Write Latency
- Save and Restore the On-Site Information of a Cluster
- Troubleshoot Cluster Setup
- Troubleshoot High Disk I/O Usage
- Troubleshoot Lock Conflicts
- Troubleshoot TiFlash
- Troubleshoot Write Conflicts in Optimistic Transactions
- Troubleshoot Inconsistency Between Data and Indexes
- Performance Tuning
- Tuning Guide
- Configuration Tuning
- System Tuning
- Software Tuning
- SQL Tuning
- Overview
- Understanding the Query Execution Plan
- SQL Optimization Process
- Overview
- Logic Optimization
- Physical Optimization
- Prepare Execution Plan Cache
- Control Execution Plans
- Tutorials
- TiDB Tools
- Overview
- Use Cases
- Download
- TiUP
- Documentation Map
- Overview
- Terminology and Concepts
- Manage TiUP Components
- FAQ
- Troubleshooting Guide
- Command Reference
- Overview
- TiUP Commands
- TiUP Cluster Commands
- Overview
- tiup cluster audit
- tiup cluster check
- tiup cluster clean
- tiup cluster deploy
- tiup cluster destroy
- tiup cluster disable
- tiup cluster display
- tiup cluster edit-config
- tiup cluster enable
- tiup cluster help
- tiup cluster import
- tiup cluster list
- tiup cluster patch
- tiup cluster prune
- tiup cluster reload
- tiup cluster rename
- tiup cluster replay
- tiup cluster restart
- tiup cluster scale-in
- tiup cluster scale-out
- tiup cluster start
- tiup cluster stop
- tiup cluster template
- tiup cluster upgrade
- TiUP DM Commands
- Overview
- tiup dm audit
- tiup dm deploy
- tiup dm destroy
- tiup dm disable
- tiup dm display
- tiup dm edit-config
- tiup dm enable
- tiup dm help
- tiup dm import
- tiup dm list
- tiup dm patch
- tiup dm prune
- tiup dm reload
- tiup dm replay
- tiup dm restart
- tiup dm scale-in
- tiup dm scale-out
- tiup dm start
- tiup dm stop
- tiup dm template
- tiup dm upgrade
- TiDB Cluster Topology Reference
- DM Cluster Topology Reference
- Mirror Reference Guide
- TiUP Components
- PingCAP Clinic Diagnostic Service
- TiDB Operator
- Dumpling
- TiDB Lightning
- TiDB Data Migration
- About TiDB Data Migration
- Architecture
- Quick Start
- Deploy a DM cluster
- Tutorials
- Advanced Tutorials
- Maintain
- Cluster Upgrade
- Tools
- Performance Tuning
- Manage Data Sources
- Manage Tasks
- Export and Import Data Sources and Task Configurations of Clusters
- Handle Alerts
- Daily Check
- Reference
- Architecture
- Command Line
- Configuration Files
- OpenAPI
- Compatibility Catalog
- Secure
- Monitoring and Alerts
- Error Codes
- Glossary
- Example
- Troubleshoot
- Release Notes
- Backup & Restore (BR)
- Point-in-Time Recovery
- TiDB Binlog
- TiCDC
- Dumpling
- sync-diff-inspector
- TiSpark
- Reference
- Cluster Architecture
- Key Monitoring Metrics
- Secure
- Privileges
- SQL
- SQL Language Structure and Syntax
- SQL Statements
ADD COLUMNADD INDEXADMINADMIN CANCEL DDLADMIN CHECKSUM TABLEADMIN CHECK [TABLE|INDEX]ADMIN SHOW DDL [JOBS|QUERIES]ADMIN SHOW TELEMETRYALTER DATABASEALTER INDEXALTER INSTANCEALTER PLACEMENT POLICYALTER TABLEALTER TABLE COMPACTALTER TABLE SET TIFLASH MODEALTER USERANALYZE TABLEBACKUPBATCHBEGINCHANGE COLUMNCOMMITCHANGE DRAINERCHANGE PUMPCREATE [GLOBAL|SESSION] BINDINGCREATE DATABASECREATE INDEXCREATE PLACEMENT POLICYCREATE ROLECREATE SEQUENCECREATE TABLE LIKECREATE TABLECREATE USERCREATE VIEWDEALLOCATEDELETEDESCDESCRIBEDODROP [GLOBAL|SESSION] BINDINGDROP COLUMNDROP DATABASEDROP INDEXDROP PLACEMENT POLICYDROP ROLEDROP SEQUENCEDROP STATSDROP TABLEDROP USERDROP VIEWEXECUTEEXPLAIN ANALYZEEXPLAINFLASHBACK TABLEFLUSH PRIVILEGESFLUSH STATUSFLUSH TABLESGRANT <privileges>GRANT <role>INSERTKILL [TIDB]LOAD DATALOAD STATSMODIFY COLUMNPREPARERECOVER TABLERENAME INDEXRENAME TABLEREPLACERESTOREREVOKE <privileges>REVOKE <role>ROLLBACKSAVEPOINTSELECTSET DEFAULT ROLESET [NAMES|CHARACTER SET]SET PASSWORDSET ROLESET TRANSACTIONSET [GLOBAL|SESSION] <variable>SHOW ANALYZE STATUSSHOW [BACKUPS|RESTORES]SHOW [GLOBAL|SESSION] BINDINGSSHOW BUILTINSSHOW CHARACTER SETSHOW COLLATIONSHOW [FULL] COLUMNS FROMSHOW CONFIGSHOW CREATE PLACEMENT POLICYSHOW CREATE SEQUENCESHOW CREATE TABLESHOW CREATE USERSHOW DATABASESSHOW DRAINER STATUSSHOW ENGINESSHOW ERRORSSHOW [FULL] FIELDS FROMSHOW GRANTSSHOW INDEX [FROM|IN]SHOW INDEXES [FROM|IN]SHOW KEYS [FROM|IN]SHOW MASTER STATUSSHOW PLACEMENTSHOW PLACEMENT FORSHOW PLACEMENT LABELSSHOW PLUGINSSHOW PRIVILEGESSHOW [FULL] PROCESSSLISTSHOW PROFILESSHOW PUMP STATUSSHOW SCHEMASSHOW STATS_HEALTHYSHOW STATS_HISTOGRAMSSHOW STATS_METASHOW STATUSSHOW TABLE NEXT_ROW_IDSHOW TABLE REGIONSSHOW TABLE STATUSSHOW [FULL] TABLESSHOW [GLOBAL|SESSION] VARIABLESSHOW WARNINGSSHUTDOWNSPLIT REGIONSTART TRANSACTIONTABLETRACETRUNCATEUPDATEUSEWITH
- Data Types
- Functions and Operators
- Overview
- Type Conversion in Expression Evaluation
- Operators
- Control Flow Functions
- String Functions
- Numeric Functions and Operators
- Date and Time Functions
- Bit Functions and Operators
- Cast Functions and Operators
- Encryption and Compression Functions
- Locking Functions
- Information Functions
- JSON Functions
- Aggregate (GROUP BY) Functions
- Window Functions
- Miscellaneous Functions
- Precision Math
- Set Operations
- List of Expressions for Pushdown
- TiDB Specific Functions
- Clustered Indexes
- Constraints
- Generated Columns
- SQL Mode
- Table Attributes
- Transactions
- Garbage Collection (GC)
- Views
- Partitioning
- Temporary Tables
- Cached Tables
- Character Set and Collation
- Placement Rules in SQL
- System Tables
mysql- INFORMATION_SCHEMA
- Overview
ANALYZE_STATUSCLIENT_ERRORS_SUMMARY_BY_HOSTCLIENT_ERRORS_SUMMARY_BY_USERCLIENT_ERRORS_SUMMARY_GLOBALCHARACTER_SETSCLUSTER_CONFIGCLUSTER_HARDWARECLUSTER_INFOCLUSTER_LOADCLUSTER_LOGCLUSTER_SYSTEMINFOCOLLATIONSCOLLATION_CHARACTER_SET_APPLICABILITYCOLUMNSDATA_LOCK_WAITSDDL_JOBSDEADLOCKSENGINESINSPECTION_RESULTINSPECTION_RULESINSPECTION_SUMMARYKEY_COLUMN_USAGEMETRICS_SUMMARYMETRICS_TABLESPARTITIONSPLACEMENT_POLICIESPROCESSLISTREFERENTIAL_CONSTRAINTSSCHEMATASEQUENCESSESSION_VARIABLESSLOW_QUERYSTATISTICSTABLESTABLE_CONSTRAINTSTABLE_STORAGE_STATSTIDB_HOT_REGIONSTIDB_HOT_REGIONS_HISTORYTIDB_INDEXESTIDB_SERVERS_INFOTIDB_TRXTIFLASH_REPLICATIKV_REGION_PEERSTIKV_REGION_STATUSTIKV_STORE_STATUSUSER_PRIVILEGESVARIABLES_INFOVIEWS
METRICS_SCHEMA
- UI
- TiDB Dashboard
- Overview
- Maintain
- Access
- Overview Page
- Cluster Info Page
- Top SQL Page
- Key Visualizer Page
- Metrics Relation Graph
- SQL Statements Analysis
- Slow Queries Page
- Cluster Diagnostics
- Monitoring Page
- Search Logs Page
- Instance Profiling
- Session Management and Configuration
- FAQ
- CLI
- Command Line Flags
- Configuration File Parameters
- System Variables
- Storage Engines
- Telemetry
- Errors Codes
- Table Filter
- Schedule Replicas by Topology Labels
- FAQs
- Release Notes
- All Releases
- Release Timeline
- TiDB Versioning
- TiDB Installation Packages
- v6.2
- v6.1
- v6.0
- v5.4
- v5.3
- v5.2
- v5.1
- v5.0
- v4.0
- v3.1
- v3.0
- v2.1
- v2.0
- v1.0
- Glossary
Slow Queries Page of TiDB Dashboard
On the Slow Queries page of TiDB Dashboard, you can search and view all slow queries in the cluster.
By default, SQL queries with an execution time of more than 300 milliseconds are considered as slow queries. These queries are recorded in the slow query logs and can be searched via TiDB Dashboard. You can adjust the threshold of slow queries through the tidb_slow_log_threshold session variable or the slow-threshold TiDB parameter.
If the slow query log is disabled, this feature will be unavailable. The slow query log is enabled by default, and you can enable or disable the slow query log through the enable-slow-log TiDB configuration item.
Access the page
You can use one of the following two methods to access the slow query page:
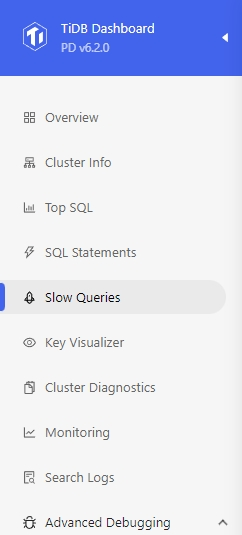
- After logging into TiDB Dashboard, click Slow Queries on the left navigation menu:
- Visit http://127.0.0.1:2379/dashboard/#/slow_query in your browser. Replace
127.0.0.1:2379with the actual PD address and port.
All data displayed on the slow query page comes from TiDB slow query system tables and slow query logs. See slow query logs for details.
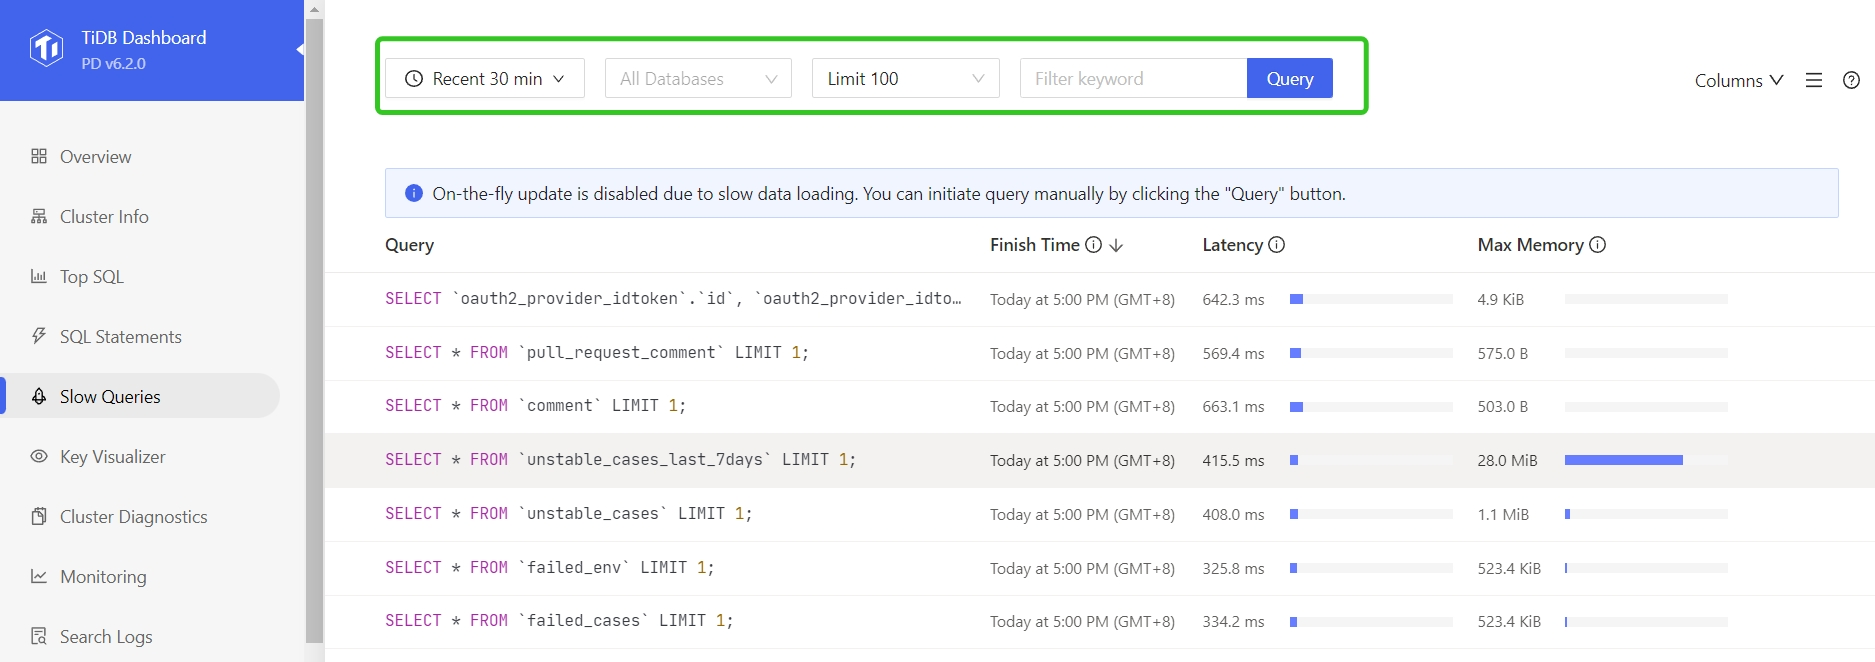
Change filters
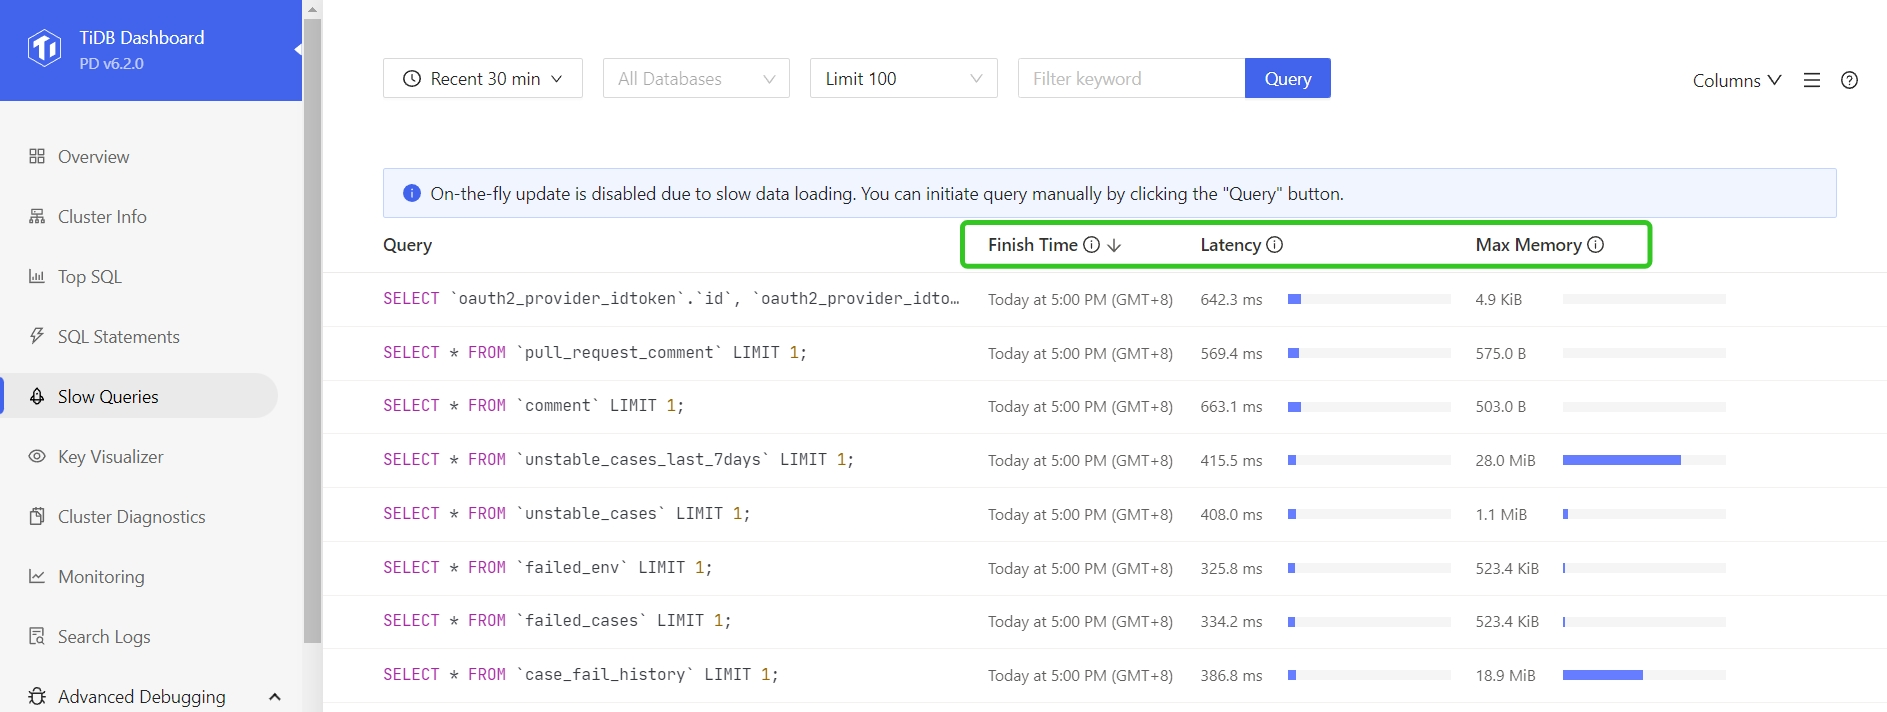
You can filter slow queries based on the time range, the related database, SQL keywords, SQL types, the number of slow queries to be displayed. In the image below, 100 slow queries over the recent 30 minutes are displayed by default.
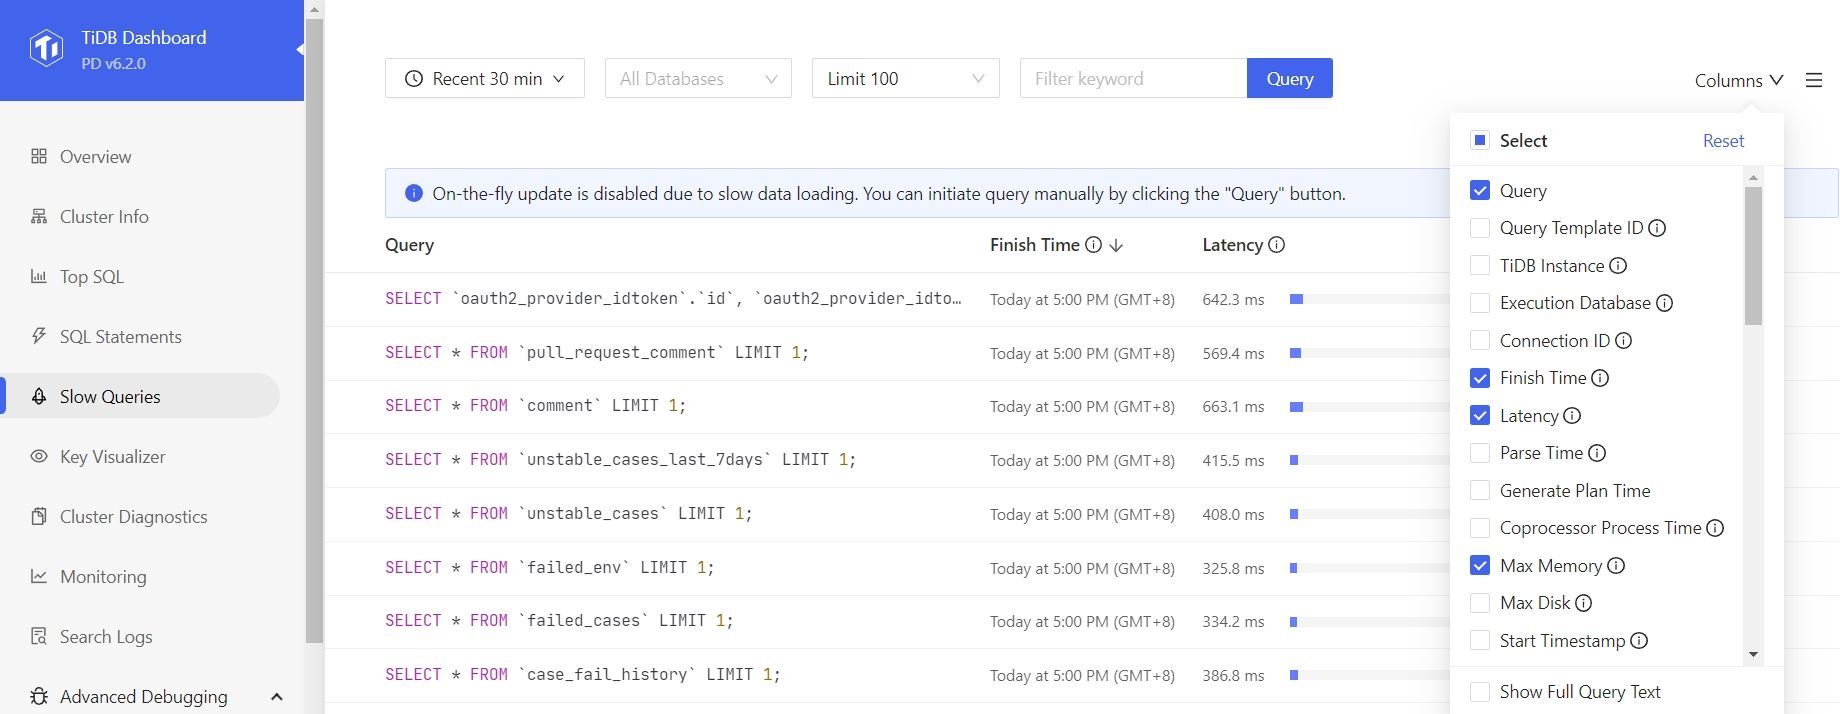
Display more columns
Click Columns on the page and you can choose to see more columns. You can move your mouse to the (i) icon at the right side of a column name to view the description of this column:
Sort by column
By default, the list is sorted by Finish Time in the descending order. Click column headings to sort by the column or switch the sorting order:
View execution details
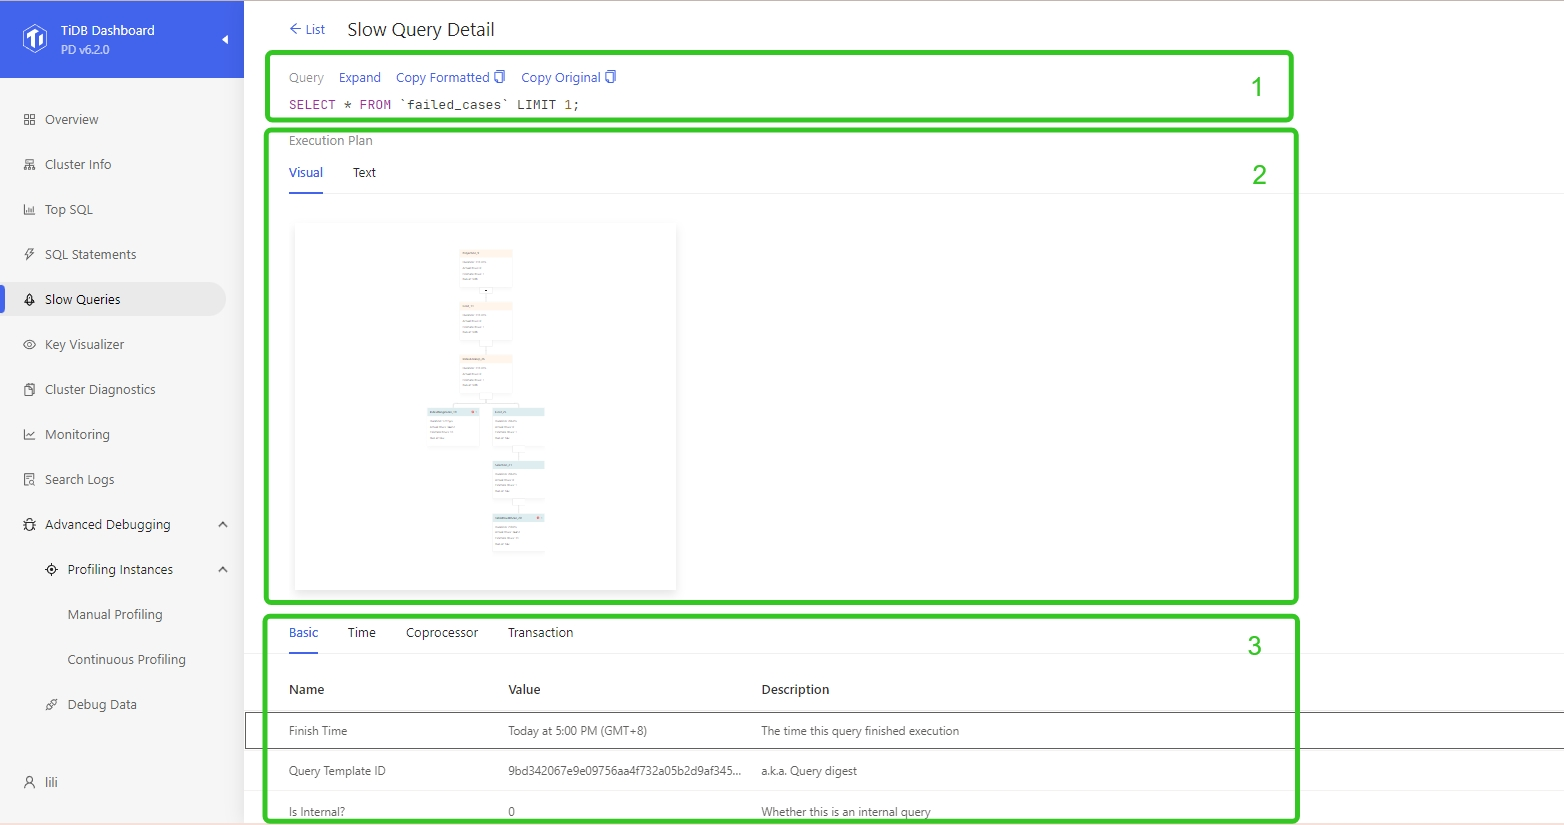
Click any item in the list to display detailed execution information of the slow query, including:
- Query: The text of the SQL statement (area 1 in the following figure)
- Plan: The execution plan of the slow query (area 2 in the following figure)
- Other sorted SQL execution information (area 3 in the following figure)
SQL
Click the Expand button to view the detailed information of an item. Click the Copy button to copy the detailed information to the clipboard.
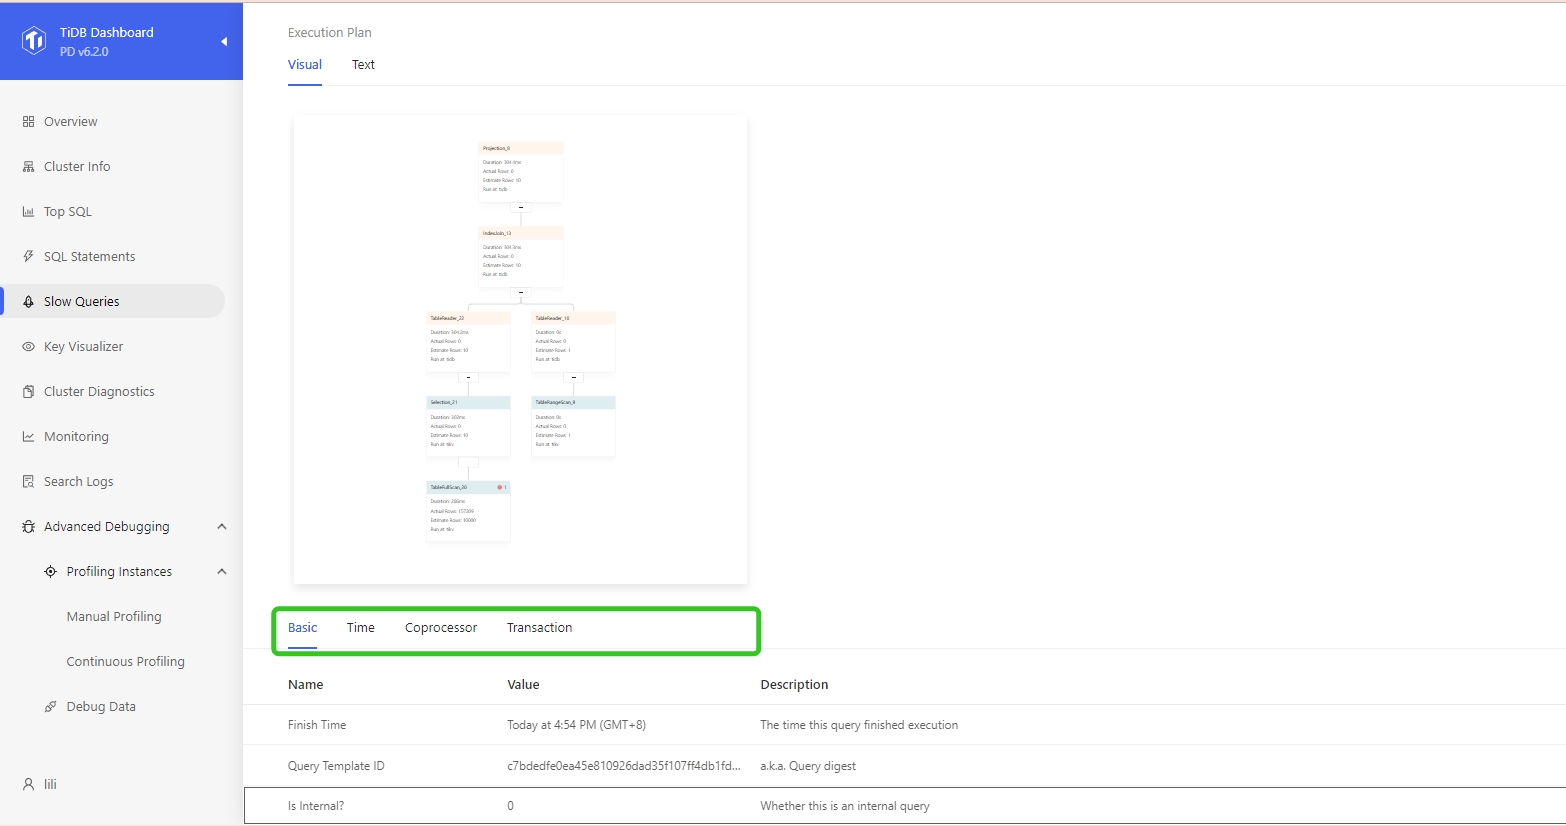
Execution plans
On TiDB Dashboard, you can view execution plans in two ways: Graph and text. Visual execution plans allow you to learn each operator of a statement and detailed information more intuitively. See Understand the Query Execution Plan to learn how to read a execution plan.
Visual execution plans
The following figure shows a visual execution plan.
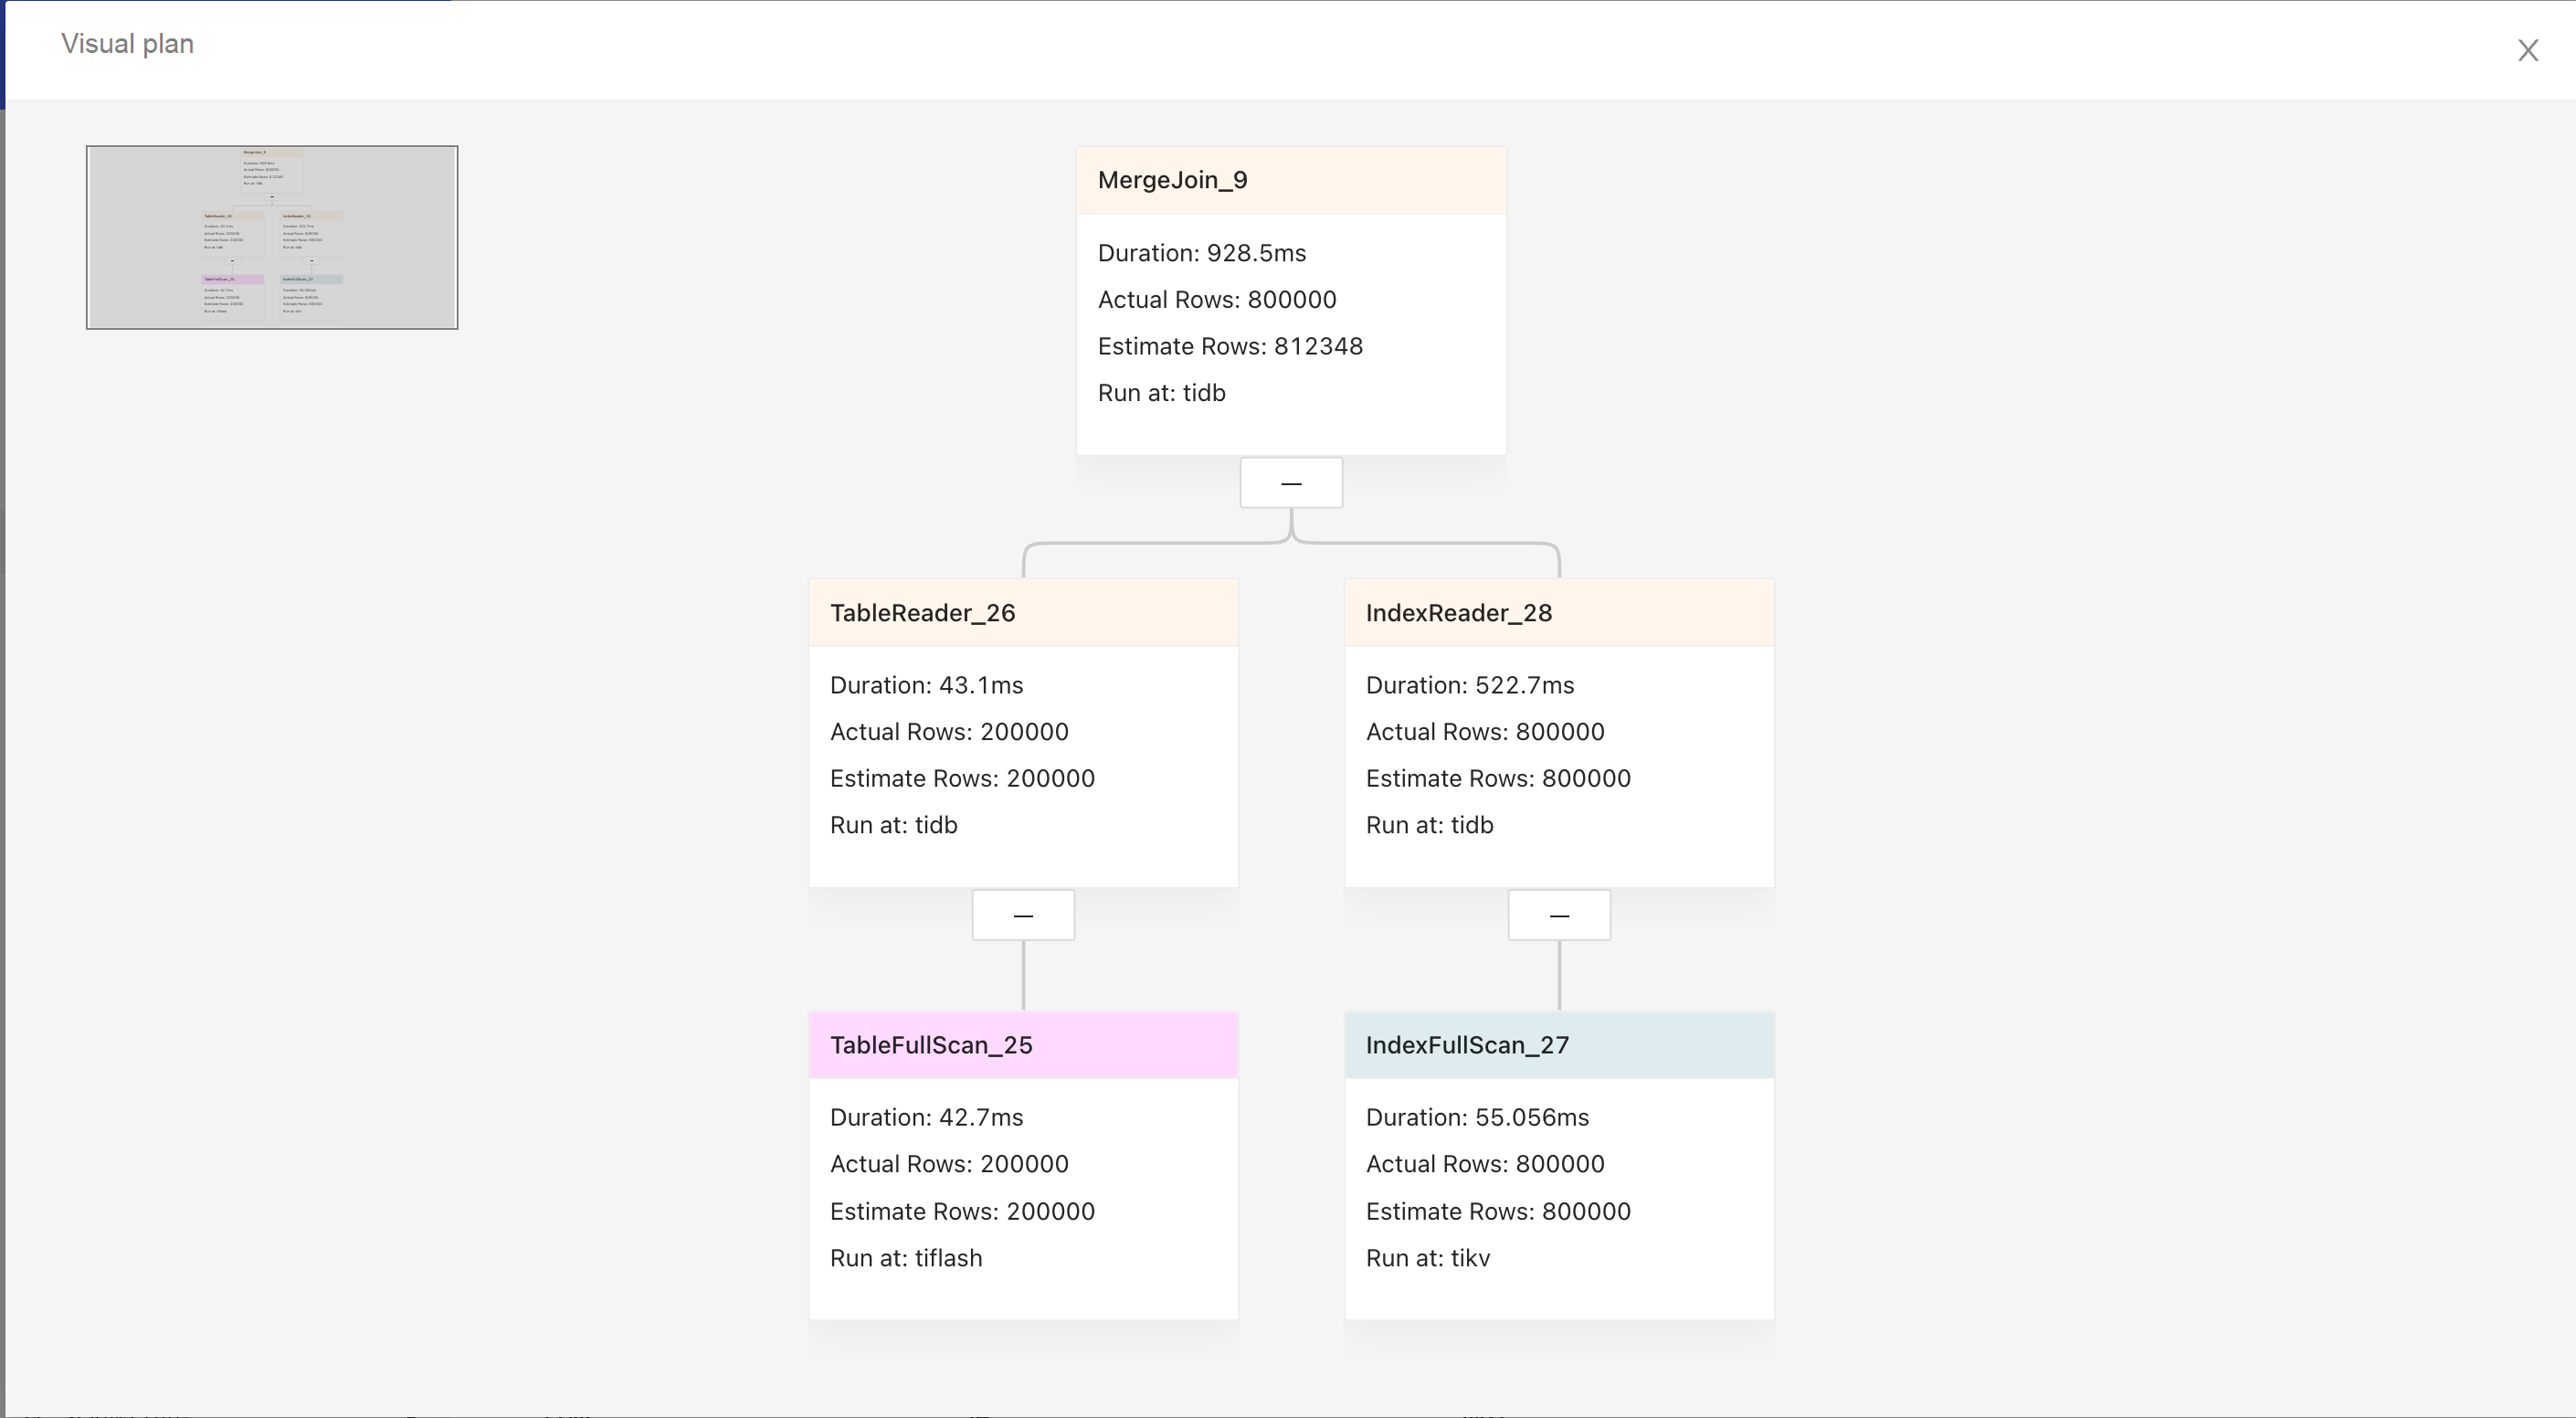
- The graph shows the execution from left to right, and from top to bottom.
- Upper nodes are parent operators and lower nodes are child operators.
- The color of the title bar indicates the component where the operator is executed: yellow stands for TiDB, blue stands for TiKV, and pink stands for TiFlash.
- The title bar shows the operator name and the text shown below is the basic information of the operator.
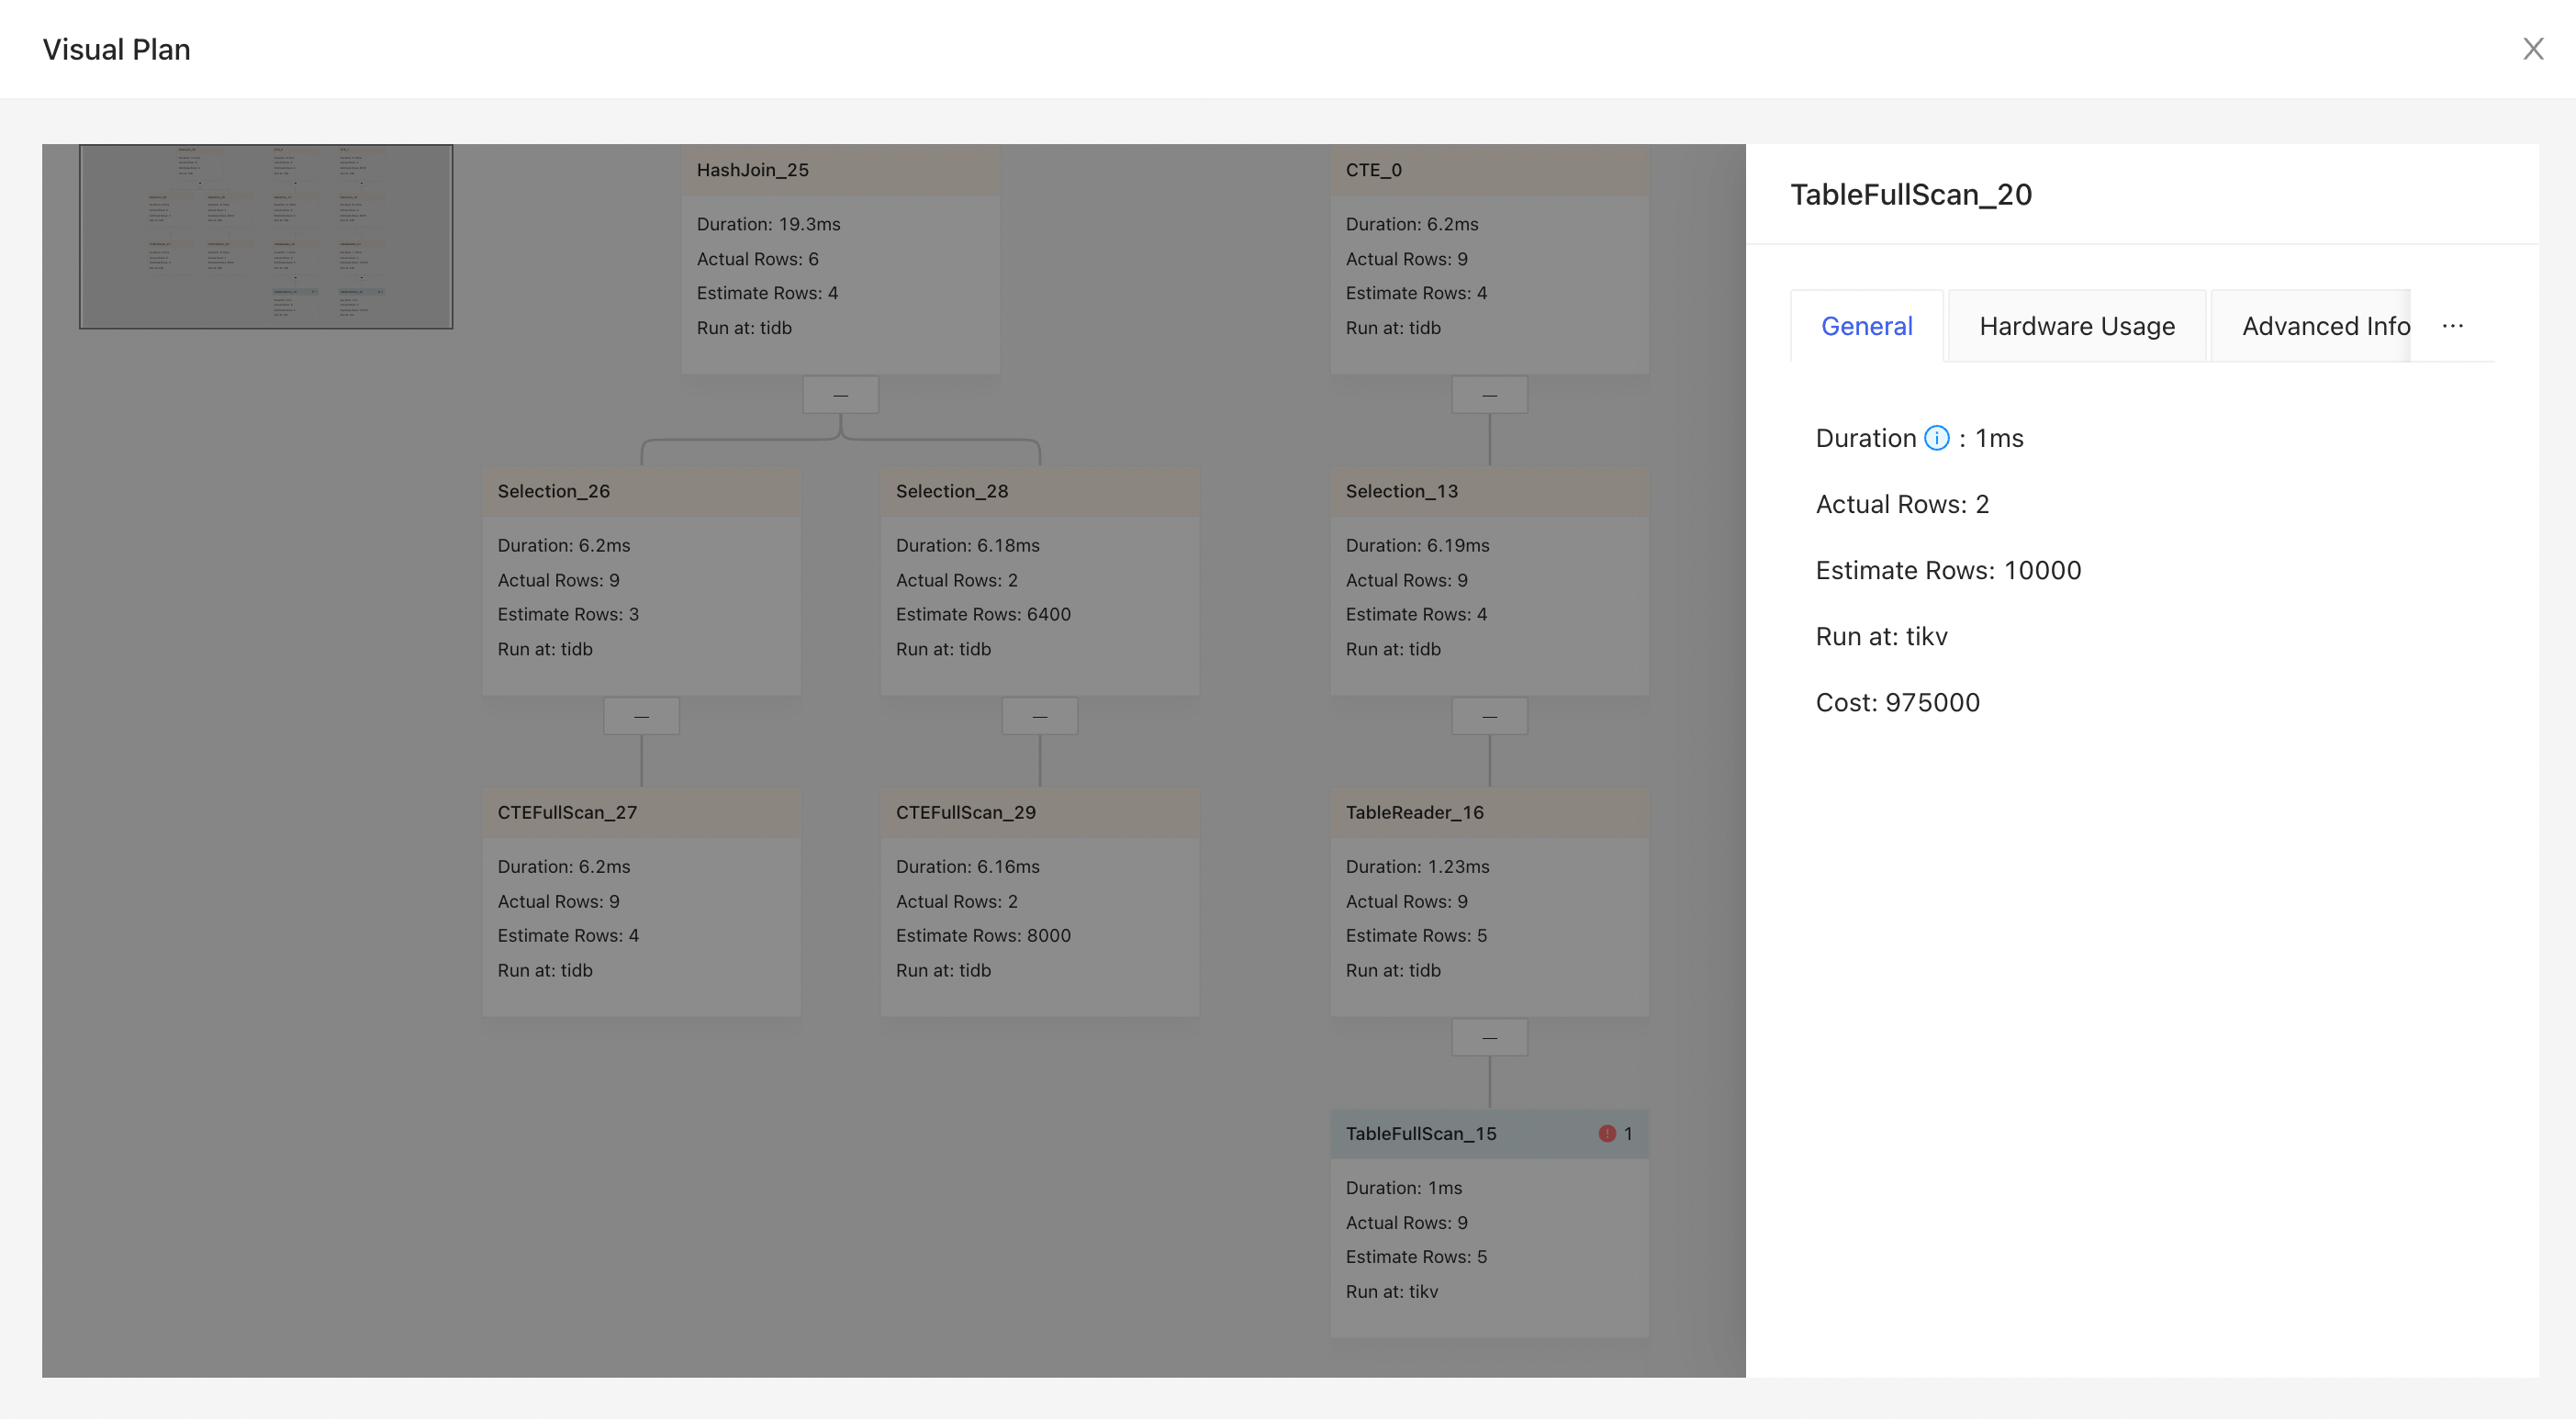
Click the node area, and the detailed operator information is displayed on the right sidebar.
SQL execution details
Click the corresponding tab titles to switch information of SQL executions.