- Docs Home
- About TiDB
- Quick Start
- Develop
- Overview
- Quick Start
- Build a TiDB Cluster in TiDB Cloud (Developer Tier)
- CRUD SQL in TiDB
- Build a Simple CRUD App with TiDB
- Example Applications
- Connect to TiDB
- Design Database Schema
- Write Data
- Read Data
- Transaction
- Optimize
- Troubleshoot
- Reference
- Cloud Native Development Environment
- Third-party Support
- Deploy
- Software and Hardware Requirements
- Environment Configuration Checklist
- Plan Cluster Topology
- Install and Start
- Verify Cluster Status
- Test Cluster Performance
- Migrate
- Overview
- Migration Tools
- Migration Scenarios
- Migrate from Aurora
- Migrate MySQL of Small Datasets
- Migrate MySQL of Large Datasets
- Migrate and Merge MySQL Shards of Small Datasets
- Migrate and Merge MySQL Shards of Large Datasets
- Migrate from CSV Files
- Migrate from SQL Files
- Migrate from One TiDB Cluster to Another TiDB Cluster
- Migrate from TiDB to MySQL-compatible Databases
- Advanced Migration
- Integrate
- Overview
- Integration Scenarios
- Maintain
- Monitor and Alert
- Troubleshoot
- TiDB Troubleshooting Map
- Identify Slow Queries
- Analyze Slow Queries
- SQL Diagnostics
- Identify Expensive Queries Using Top SQL
- Identify Expensive Queries Using Logs
- Statement Summary Tables
- Troubleshoot Hotspot Issues
- Troubleshoot Increased Read and Write Latency
- Save and Restore the On-Site Information of a Cluster
- Troubleshoot Cluster Setup
- Troubleshoot High Disk I/O Usage
- Troubleshoot Lock Conflicts
- Troubleshoot TiFlash
- Troubleshoot Write Conflicts in Optimistic Transactions
- Troubleshoot Inconsistency Between Data and Indexes
- Performance Tuning
- Tuning Guide
- Configuration Tuning
- System Tuning
- Software Tuning
- SQL Tuning
- Overview
- Understanding the Query Execution Plan
- SQL Optimization Process
- Overview
- Logic Optimization
- Physical Optimization
- Prepare Execution Plan Cache
- Control Execution Plans
- Tutorials
- TiDB Tools
- Overview
- Use Cases
- Download
- TiUP
- Documentation Map
- Overview
- Terminology and Concepts
- Manage TiUP Components
- FAQ
- Troubleshooting Guide
- Command Reference
- Overview
- TiUP Commands
- TiUP Cluster Commands
- Overview
- tiup cluster audit
- tiup cluster check
- tiup cluster clean
- tiup cluster deploy
- tiup cluster destroy
- tiup cluster disable
- tiup cluster display
- tiup cluster edit-config
- tiup cluster enable
- tiup cluster help
- tiup cluster import
- tiup cluster list
- tiup cluster patch
- tiup cluster prune
- tiup cluster reload
- tiup cluster rename
- tiup cluster replay
- tiup cluster restart
- tiup cluster scale-in
- tiup cluster scale-out
- tiup cluster start
- tiup cluster stop
- tiup cluster template
- tiup cluster upgrade
- TiUP DM Commands
- Overview
- tiup dm audit
- tiup dm deploy
- tiup dm destroy
- tiup dm disable
- tiup dm display
- tiup dm edit-config
- tiup dm enable
- tiup dm help
- tiup dm import
- tiup dm list
- tiup dm patch
- tiup dm prune
- tiup dm reload
- tiup dm replay
- tiup dm restart
- tiup dm scale-in
- tiup dm scale-out
- tiup dm start
- tiup dm stop
- tiup dm template
- tiup dm upgrade
- TiDB Cluster Topology Reference
- DM Cluster Topology Reference
- Mirror Reference Guide
- TiUP Components
- PingCAP Clinic Diagnostic Service
- TiDB Operator
- Dumpling
- TiDB Lightning
- TiDB Data Migration
- About TiDB Data Migration
- Architecture
- Quick Start
- Deploy a DM cluster
- Tutorials
- Advanced Tutorials
- Maintain
- Cluster Upgrade
- Tools
- Performance Tuning
- Manage Data Sources
- Manage Tasks
- Export and Import Data Sources and Task Configurations of Clusters
- Handle Alerts
- Daily Check
- Reference
- Architecture
- Command Line
- Configuration Files
- OpenAPI
- Compatibility Catalog
- Secure
- Monitoring and Alerts
- Error Codes
- Glossary
- Example
- Troubleshoot
- Release Notes
- Backup & Restore (BR)
- Point-in-Time Recovery
- TiDB Binlog
- TiCDC
- Dumpling
- sync-diff-inspector
- TiSpark
- Reference
- Cluster Architecture
- Key Monitoring Metrics
- Secure
- Privileges
- SQL
- SQL Language Structure and Syntax
- SQL Statements
ADD COLUMNADD INDEXADMINADMIN CANCEL DDLADMIN CHECKSUM TABLEADMIN CHECK [TABLE|INDEX]ADMIN SHOW DDL [JOBS|QUERIES]ADMIN SHOW TELEMETRYALTER DATABASEALTER INDEXALTER INSTANCEALTER PLACEMENT POLICYALTER TABLEALTER TABLE COMPACTALTER TABLE SET TIFLASH MODEALTER USERANALYZE TABLEBACKUPBATCHBEGINCHANGE COLUMNCOMMITCHANGE DRAINERCHANGE PUMPCREATE [GLOBAL|SESSION] BINDINGCREATE DATABASECREATE INDEXCREATE PLACEMENT POLICYCREATE ROLECREATE SEQUENCECREATE TABLE LIKECREATE TABLECREATE USERCREATE VIEWDEALLOCATEDELETEDESCDESCRIBEDODROP [GLOBAL|SESSION] BINDINGDROP COLUMNDROP DATABASEDROP INDEXDROP PLACEMENT POLICYDROP ROLEDROP SEQUENCEDROP STATSDROP TABLEDROP USERDROP VIEWEXECUTEEXPLAIN ANALYZEEXPLAINFLASHBACK TABLEFLUSH PRIVILEGESFLUSH STATUSFLUSH TABLESGRANT <privileges>GRANT <role>INSERTKILL [TIDB]LOAD DATALOAD STATSMODIFY COLUMNPREPARERECOVER TABLERENAME INDEXRENAME TABLEREPLACERESTOREREVOKE <privileges>REVOKE <role>ROLLBACKSAVEPOINTSELECTSET DEFAULT ROLESET [NAMES|CHARACTER SET]SET PASSWORDSET ROLESET TRANSACTIONSET [GLOBAL|SESSION] <variable>SHOW ANALYZE STATUSSHOW [BACKUPS|RESTORES]SHOW [GLOBAL|SESSION] BINDINGSSHOW BUILTINSSHOW CHARACTER SETSHOW COLLATIONSHOW [FULL] COLUMNS FROMSHOW CONFIGSHOW CREATE PLACEMENT POLICYSHOW CREATE SEQUENCESHOW CREATE TABLESHOW CREATE USERSHOW DATABASESSHOW DRAINER STATUSSHOW ENGINESSHOW ERRORSSHOW [FULL] FIELDS FROMSHOW GRANTSSHOW INDEX [FROM|IN]SHOW INDEXES [FROM|IN]SHOW KEYS [FROM|IN]SHOW MASTER STATUSSHOW PLACEMENTSHOW PLACEMENT FORSHOW PLACEMENT LABELSSHOW PLUGINSSHOW PRIVILEGESSHOW [FULL] PROCESSSLISTSHOW PROFILESSHOW PUMP STATUSSHOW SCHEMASSHOW STATS_HEALTHYSHOW STATS_HISTOGRAMSSHOW STATS_METASHOW STATUSSHOW TABLE NEXT_ROW_IDSHOW TABLE REGIONSSHOW TABLE STATUSSHOW [FULL] TABLESSHOW [GLOBAL|SESSION] VARIABLESSHOW WARNINGSSHUTDOWNSPLIT REGIONSTART TRANSACTIONTABLETRACETRUNCATEUPDATEUSEWITH
- Data Types
- Functions and Operators
- Overview
- Type Conversion in Expression Evaluation
- Operators
- Control Flow Functions
- String Functions
- Numeric Functions and Operators
- Date and Time Functions
- Bit Functions and Operators
- Cast Functions and Operators
- Encryption and Compression Functions
- Locking Functions
- Information Functions
- JSON Functions
- Aggregate (GROUP BY) Functions
- Window Functions
- Miscellaneous Functions
- Precision Math
- Set Operations
- List of Expressions for Pushdown
- TiDB Specific Functions
- Clustered Indexes
- Constraints
- Generated Columns
- SQL Mode
- Table Attributes
- Transactions
- Garbage Collection (GC)
- Views
- Partitioning
- Temporary Tables
- Cached Tables
- Character Set and Collation
- Placement Rules in SQL
- System Tables
mysql- INFORMATION_SCHEMA
- Overview
ANALYZE_STATUSCLIENT_ERRORS_SUMMARY_BY_HOSTCLIENT_ERRORS_SUMMARY_BY_USERCLIENT_ERRORS_SUMMARY_GLOBALCHARACTER_SETSCLUSTER_CONFIGCLUSTER_HARDWARECLUSTER_INFOCLUSTER_LOADCLUSTER_LOGCLUSTER_SYSTEMINFOCOLLATIONSCOLLATION_CHARACTER_SET_APPLICABILITYCOLUMNSDATA_LOCK_WAITSDDL_JOBSDEADLOCKSENGINESINSPECTION_RESULTINSPECTION_RULESINSPECTION_SUMMARYKEY_COLUMN_USAGEMETRICS_SUMMARYMETRICS_TABLESPARTITIONSPLACEMENT_POLICIESPROCESSLISTREFERENTIAL_CONSTRAINTSSCHEMATASEQUENCESSESSION_VARIABLESSLOW_QUERYSTATISTICSTABLESTABLE_CONSTRAINTSTABLE_STORAGE_STATSTIDB_HOT_REGIONSTIDB_HOT_REGIONS_HISTORYTIDB_INDEXESTIDB_SERVERS_INFOTIDB_TRXTIFLASH_REPLICATIKV_REGION_PEERSTIKV_REGION_STATUSTIKV_STORE_STATUSUSER_PRIVILEGESVARIABLES_INFOVIEWS
METRICS_SCHEMA
- UI
- TiDB Dashboard
- Overview
- Maintain
- Access
- Overview Page
- Cluster Info Page
- Top SQL Page
- Key Visualizer Page
- Metrics Relation Graph
- SQL Statements Analysis
- Slow Queries Page
- Cluster Diagnostics
- Monitoring Page
- Search Logs Page
- Instance Profiling
- Session Management and Configuration
- FAQ
- CLI
- Command Line Flags
- Configuration File Parameters
- System Variables
- Storage Engines
- Telemetry
- Errors Codes
- Table Filter
- Schedule Replicas by Topology Labels
- FAQs
- Release Notes
- All Releases
- Release Timeline
- TiDB Versioning
- TiDB Installation Packages
- v6.2
- v6.1
- v6.0
- v5.4
- v5.3
- v5.2
- v5.1
- v5.0
- v4.0
- v3.1
- v3.0
- v2.1
- v2.0
- v1.0
- Glossary
Troubleshoot Write Conflicts in Optimistic Transactions
This document introduces the reason of and solutions to write conflicts in optimistic transactions.
Before TiDB v3.0.8, TiDB uses the optimistic transaction model by default. In this model, TiDB does not check conflicts during transaction execution. Instead, while the transaction is finally committed, the two-phase commit (2PC) is triggered and TiDB checks write conflicts. If a write conflict exists and the auto-retry mechanism is enabled, then TiDB retries the transaction within limited times. If the retry succeeds or has reached the upper limit on retry times, TiDB returns the result of transaction execution to the client. Therefore, if a lot of write conflicts exist in the TiDB cluster, the duration can be longer.
The reason of write conflicts
TiDB implements its transactions by using the Percolator transaction model. percolator is generally an implementation of 2PC. For the detailed 2PC process, see TiDB Optimistic Transaction Model.
After the client sends a COMMIT request to TiDB, TiDB starts the 2PC process:
- TiDB chooses one key from all keys in the transaction as the primary key of the transaction.
- TiDB sends the
prewriterequest to all the TiKV Regions involved in this commit. TiKV judges whether all keys can preview successfully. - TiDB receives the result that all
prewriterequests are successful. - TiDB gets the
commit_tsfrom PD. - TiDB sends the
commitrequest to the TiKV Region that contains the primary key of the transaction. After TiKV receives thecommitrequest, it checks the validity of the data and clears the locks left in theprewritestage. - After the
commitrequest returns successfully, TiDB returns success to the client.
The write conflict occurs in the prewrite stage. When the transaction finds that another transaction is writing the current key (data.commit_ts > txn.start_ts), a write conflict occurs.
Detect write conflicts
In the TiDB Grafana panel, check the following monitoring metrics under KV Errors:
KV Backoff OPS indicates the count of error messages per second returned by TiKV.
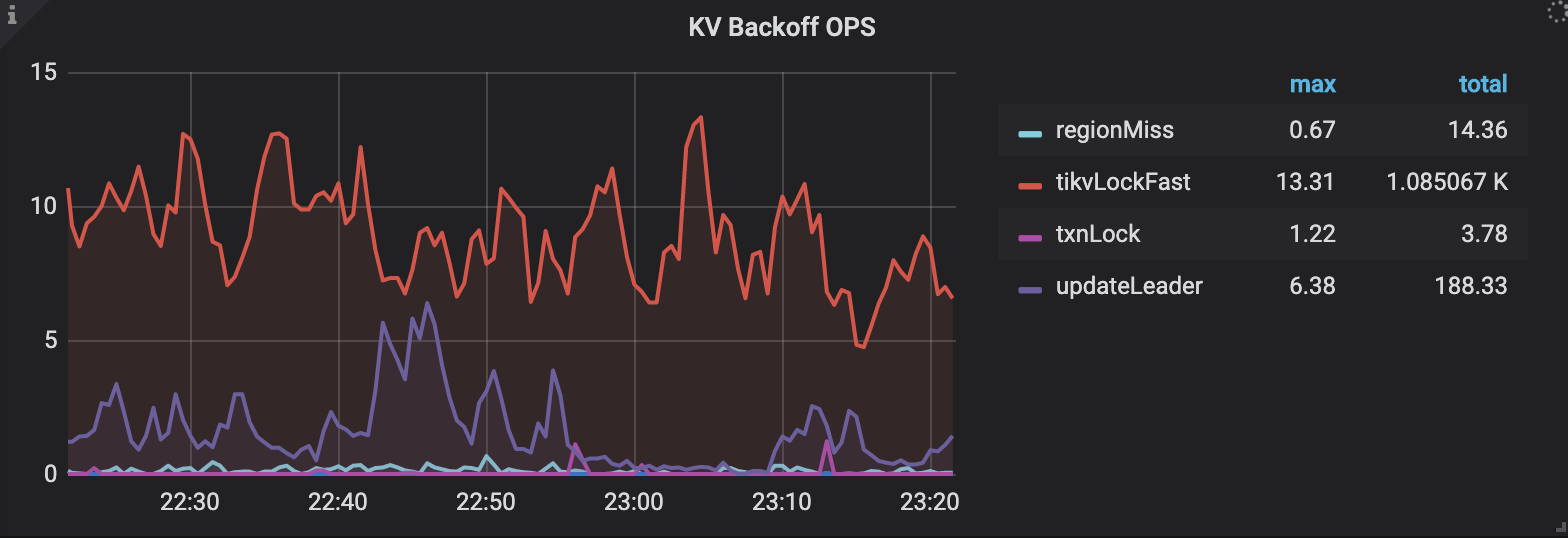
The
txnlockmetric indicates the write-write conflict. ThetxnLockFastmetric indicates the read-write conflict.Lock Resolve OPS indicates the count of items related to transaction conflicts per second:
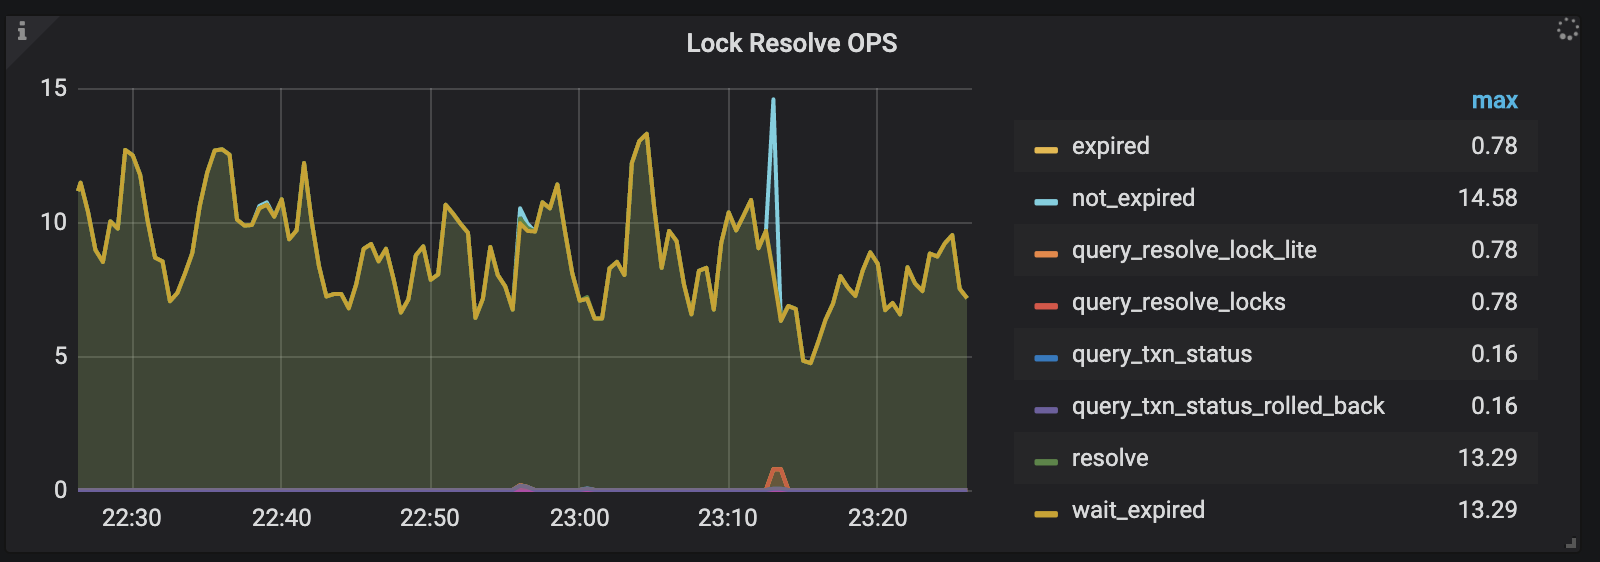
not_expiredindicates the TTL of the lock was not expired. The conflict transaction cannot resolve locks until the TTL is expired.wait_expiredindicates that the transaction needs to wait the lock to expire.expiredindicates the TTL of the lock was expired. Then the conflict transaction can resolve this lock.
KV Retry Duration indicates the duration of re-sends the KV request:
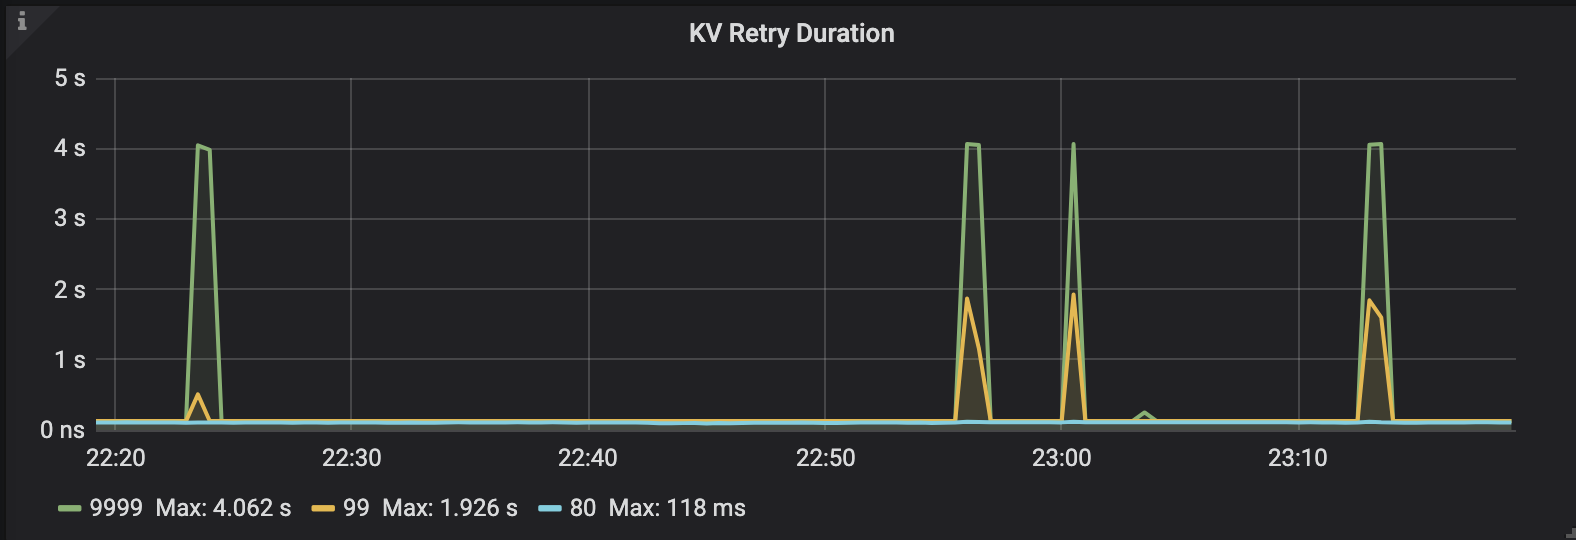
You can also use [kv:9007]Write conflict as the keywords to search in the TiDB log. The keywords also indicate the write conflict exists in the cluster.
Resolve write conflicts
If many write conflicts exist in the cluster, it is recommended to find out the write conflict key and the reason, and then try to change the application logic to avoid write conflicts. When the write conflict exists in the cluster, you can see the log similar to the following one in the TiDB log file:
[2020/05/12 15:17:01.568 +08:00] [WARN] [session.go:446] ["commit failed"] [conn=3] ["finished txn"="Txn{state=invalid}"] [error="[kv:9007]Write conflict, txnStartTS=416617006551793665, conflictStartTS=416617018650001409, conflictCommitTS=416617023093080065, key={tableID=47, indexID=1, indexValues={string, }} primary={tableID=47, indexID=1, indexValues={string, }} [try again later]"]
The explanation of the log above is as follows:
[kv:9007]Write conflict: indicates the write-write conflict.txnStartTS=416617006551793665: indicates thestart_tsof the current transaction. You can use thepd-ctltool to convertstart_tsto physical time.conflictStartTS=416617018650001409: indicates thestart_tsof the write conflict transaction.conflictCommitTS=416617023093080065: indicates thecommit_tsof the write conflict transaction.key={tableID=47, indexID=1, indexValues={string, }}: indicates the write conflict key.tableIDindicates the ID of the write conflict table.indexIDindicates the ID of write conflict index. If the write conflict key is a record key, the log printshandle=x, indicating which record(row) has a conflict.indexValuesindicates the value of the index that has a conflict.primary={tableID=47, indexID=1, indexValues={string, }}: indicates the primary key information of the current transaction.
You can use the pd-ctl tool to convert the timestamp to readable time:
tiup ctl pd -u https://127.0.0.1:2379 tso {TIMESTAMP}
You can use tableID to find the name of the related table:
curl http://{TiDBIP}:10080/db-table/{tableID}
You can use indexID and the table name to find the name of the related index:
SELECT * FROM INFORMATION_SCHEMA.TIDB_INDEXES WHERE TABLE_SCHEMA='{db_name}' AND TABLE_NAME='{table_name}' AND INDEX_ID={indexID};
In addition, in TiDB v3.0.8 and later versions, the pessimistic transaction becomes the default mode. The pessimistic transaction mode can avoid write conflicts during the transaction prewrite stage, so you do not need to modify the application any more. In the pessimistic transaction mode, each DML statement writes a pessimistic lock to the related keys during execution. This pessimistic lock can prevent other transactions from modifying the same keys, thus ensuring no write conflicts exist in the prewrite stage of the transaction 2PC.