- Docs Home
- About TiDB
- Quick Start
- Develop
- Overview
- Quick Start
- Build a TiDB Cluster in TiDB Cloud (Developer Tier)
- CRUD SQL in TiDB
- Build a Simple CRUD App with TiDB
- Example Applications
- Connect to TiDB
- Design Database Schema
- Write Data
- Read Data
- Transaction
- Optimize
- Troubleshoot
- Reference
- Cloud Native Development Environment
- Third-party Support
- Deploy
- Software and Hardware Requirements
- Environment Configuration Checklist
- Plan Cluster Topology
- Install and Start
- Verify Cluster Status
- Test Cluster Performance
- Migrate
- Overview
- Migration Tools
- Migration Scenarios
- Migrate from Aurora
- Migrate MySQL of Small Datasets
- Migrate MySQL of Large Datasets
- Migrate and Merge MySQL Shards of Small Datasets
- Migrate and Merge MySQL Shards of Large Datasets
- Migrate from CSV Files
- Migrate from SQL Files
- Migrate from One TiDB Cluster to Another TiDB Cluster
- Migrate from TiDB to MySQL-compatible Databases
- Advanced Migration
- Integrate
- Overview
- Integration Scenarios
- Maintain
- Monitor and Alert
- Troubleshoot
- TiDB Troubleshooting Map
- Identify Slow Queries
- Analyze Slow Queries
- SQL Diagnostics
- Identify Expensive Queries Using Top SQL
- Identify Expensive Queries Using Logs
- Statement Summary Tables
- Troubleshoot Hotspot Issues
- Troubleshoot Increased Read and Write Latency
- Save and Restore the On-Site Information of a Cluster
- Troubleshoot Cluster Setup
- Troubleshoot High Disk I/O Usage
- Troubleshoot Lock Conflicts
- Troubleshoot TiFlash
- Troubleshoot Write Conflicts in Optimistic Transactions
- Troubleshoot Inconsistency Between Data and Indexes
- Performance Tuning
- Tuning Guide
- Configuration Tuning
- System Tuning
- Software Tuning
- SQL Tuning
- Overview
- Understanding the Query Execution Plan
- SQL Optimization Process
- Overview
- Logic Optimization
- Physical Optimization
- Prepare Execution Plan Cache
- Control Execution Plans
- Tutorials
- TiDB Tools
- Overview
- Use Cases
- Download
- TiUP
- Documentation Map
- Overview
- Terminology and Concepts
- Manage TiUP Components
- FAQ
- Troubleshooting Guide
- Command Reference
- Overview
- TiUP Commands
- TiUP Cluster Commands
- Overview
- tiup cluster audit
- tiup cluster check
- tiup cluster clean
- tiup cluster deploy
- tiup cluster destroy
- tiup cluster disable
- tiup cluster display
- tiup cluster edit-config
- tiup cluster enable
- tiup cluster help
- tiup cluster import
- tiup cluster list
- tiup cluster patch
- tiup cluster prune
- tiup cluster reload
- tiup cluster rename
- tiup cluster replay
- tiup cluster restart
- tiup cluster scale-in
- tiup cluster scale-out
- tiup cluster start
- tiup cluster stop
- tiup cluster template
- tiup cluster upgrade
- TiUP DM Commands
- Overview
- tiup dm audit
- tiup dm deploy
- tiup dm destroy
- tiup dm disable
- tiup dm display
- tiup dm edit-config
- tiup dm enable
- tiup dm help
- tiup dm import
- tiup dm list
- tiup dm patch
- tiup dm prune
- tiup dm reload
- tiup dm replay
- tiup dm restart
- tiup dm scale-in
- tiup dm scale-out
- tiup dm start
- tiup dm stop
- tiup dm template
- tiup dm upgrade
- TiDB Cluster Topology Reference
- DM Cluster Topology Reference
- Mirror Reference Guide
- TiUP Components
- PingCAP Clinic Diagnostic Service
- TiDB Operator
- Dumpling
- TiDB Lightning
- TiDB Data Migration
- About TiDB Data Migration
- Architecture
- Quick Start
- Deploy a DM cluster
- Tutorials
- Advanced Tutorials
- Maintain
- Cluster Upgrade
- Tools
- Performance Tuning
- Manage Data Sources
- Manage Tasks
- Export and Import Data Sources and Task Configurations of Clusters
- Handle Alerts
- Daily Check
- Reference
- Architecture
- Command Line
- Configuration Files
- OpenAPI
- Compatibility Catalog
- Secure
- Monitoring and Alerts
- Error Codes
- Glossary
- Example
- Troubleshoot
- Release Notes
- Backup & Restore (BR)
- Point-in-Time Recovery
- TiDB Binlog
- TiCDC
- Dumpling
- sync-diff-inspector
- TiSpark
- Reference
- Cluster Architecture
- Key Monitoring Metrics
- Secure
- Privileges
- SQL
- SQL Language Structure and Syntax
- SQL Statements
ADD COLUMNADD INDEXADMINADMIN CANCEL DDLADMIN CHECKSUM TABLEADMIN CHECK [TABLE|INDEX]ADMIN SHOW DDL [JOBS|QUERIES]ADMIN SHOW TELEMETRYALTER DATABASEALTER INDEXALTER INSTANCEALTER PLACEMENT POLICYALTER TABLEALTER TABLE COMPACTALTER TABLE SET TIFLASH MODEALTER USERANALYZE TABLEBACKUPBATCHBEGINCHANGE COLUMNCOMMITCHANGE DRAINERCHANGE PUMPCREATE [GLOBAL|SESSION] BINDINGCREATE DATABASECREATE INDEXCREATE PLACEMENT POLICYCREATE ROLECREATE SEQUENCECREATE TABLE LIKECREATE TABLECREATE USERCREATE VIEWDEALLOCATEDELETEDESCDESCRIBEDODROP [GLOBAL|SESSION] BINDINGDROP COLUMNDROP DATABASEDROP INDEXDROP PLACEMENT POLICYDROP ROLEDROP SEQUENCEDROP STATSDROP TABLEDROP USERDROP VIEWEXECUTEEXPLAIN ANALYZEEXPLAINFLASHBACK TABLEFLUSH PRIVILEGESFLUSH STATUSFLUSH TABLESGRANT <privileges>GRANT <role>INSERTKILL [TIDB]LOAD DATALOAD STATSMODIFY COLUMNPREPARERECOVER TABLERENAME INDEXRENAME TABLEREPLACERESTOREREVOKE <privileges>REVOKE <role>ROLLBACKSAVEPOINTSELECTSET DEFAULT ROLESET [NAMES|CHARACTER SET]SET PASSWORDSET ROLESET TRANSACTIONSET [GLOBAL|SESSION] <variable>SHOW ANALYZE STATUSSHOW [BACKUPS|RESTORES]SHOW [GLOBAL|SESSION] BINDINGSSHOW BUILTINSSHOW CHARACTER SETSHOW COLLATIONSHOW [FULL] COLUMNS FROMSHOW CONFIGSHOW CREATE PLACEMENT POLICYSHOW CREATE SEQUENCESHOW CREATE TABLESHOW CREATE USERSHOW DATABASESSHOW DRAINER STATUSSHOW ENGINESSHOW ERRORSSHOW [FULL] FIELDS FROMSHOW GRANTSSHOW INDEX [FROM|IN]SHOW INDEXES [FROM|IN]SHOW KEYS [FROM|IN]SHOW MASTER STATUSSHOW PLACEMENTSHOW PLACEMENT FORSHOW PLACEMENT LABELSSHOW PLUGINSSHOW PRIVILEGESSHOW [FULL] PROCESSSLISTSHOW PROFILESSHOW PUMP STATUSSHOW SCHEMASSHOW STATS_HEALTHYSHOW STATS_HISTOGRAMSSHOW STATS_METASHOW STATUSSHOW TABLE NEXT_ROW_IDSHOW TABLE REGIONSSHOW TABLE STATUSSHOW [FULL] TABLESSHOW [GLOBAL|SESSION] VARIABLESSHOW WARNINGSSHUTDOWNSPLIT REGIONSTART TRANSACTIONTABLETRACETRUNCATEUPDATEUSEWITH
- Data Types
- Functions and Operators
- Overview
- Type Conversion in Expression Evaluation
- Operators
- Control Flow Functions
- String Functions
- Numeric Functions and Operators
- Date and Time Functions
- Bit Functions and Operators
- Cast Functions and Operators
- Encryption and Compression Functions
- Locking Functions
- Information Functions
- JSON Functions
- Aggregate (GROUP BY) Functions
- Window Functions
- Miscellaneous Functions
- Precision Math
- Set Operations
- List of Expressions for Pushdown
- TiDB Specific Functions
- Clustered Indexes
- Constraints
- Generated Columns
- SQL Mode
- Table Attributes
- Transactions
- Garbage Collection (GC)
- Views
- Partitioning
- Temporary Tables
- Cached Tables
- Character Set and Collation
- Placement Rules in SQL
- System Tables
mysql- INFORMATION_SCHEMA
- Overview
ANALYZE_STATUSCLIENT_ERRORS_SUMMARY_BY_HOSTCLIENT_ERRORS_SUMMARY_BY_USERCLIENT_ERRORS_SUMMARY_GLOBALCHARACTER_SETSCLUSTER_CONFIGCLUSTER_HARDWARECLUSTER_INFOCLUSTER_LOADCLUSTER_LOGCLUSTER_SYSTEMINFOCOLLATIONSCOLLATION_CHARACTER_SET_APPLICABILITYCOLUMNSDATA_LOCK_WAITSDDL_JOBSDEADLOCKSENGINESINSPECTION_RESULTINSPECTION_RULESINSPECTION_SUMMARYKEY_COLUMN_USAGEMETRICS_SUMMARYMETRICS_TABLESPARTITIONSPLACEMENT_POLICIESPROCESSLISTREFERENTIAL_CONSTRAINTSSCHEMATASEQUENCESSESSION_VARIABLESSLOW_QUERYSTATISTICSTABLESTABLE_CONSTRAINTSTABLE_STORAGE_STATSTIDB_HOT_REGIONSTIDB_HOT_REGIONS_HISTORYTIDB_INDEXESTIDB_SERVERS_INFOTIDB_TRXTIFLASH_REPLICATIKV_REGION_PEERSTIKV_REGION_STATUSTIKV_STORE_STATUSUSER_PRIVILEGESVARIABLES_INFOVIEWS
METRICS_SCHEMA
- UI
- TiDB Dashboard
- Overview
- Maintain
- Access
- Overview Page
- Cluster Info Page
- Top SQL Page
- Key Visualizer Page
- Metrics Relation Graph
- SQL Statements Analysis
- Slow Queries Page
- Cluster Diagnostics
- Monitoring Page
- Search Logs Page
- Instance Profiling
- Session Management and Configuration
- FAQ
- CLI
- Command Line Flags
- Configuration File Parameters
- System Variables
- Storage Engines
- Telemetry
- Errors Codes
- Table Filter
- Schedule Replicas by Topology Labels
- FAQs
- Release Notes
- All Releases
- Release Timeline
- TiDB Versioning
- TiDB Installation Packages
- v6.2
- v6.1
- v6.0
- v5.4
- v5.3
- v5.2
- v5.1
- v5.0
- v4.0
- v3.1
- v3.0
- v2.1
- v2.0
- v1.0
- Glossary
Best Practices for Three-Node Hybrid Deployment
For a TiDB cluster, if you have no requirements on high performance but need to control the cost, you can deploy the TiDB, TiKV, and PD components on three machines in a hybrid way.
This document offers an example of three-node hybrid deployment and a TPC-C test against the deployed cluster. Based on this example, this document offers best practices for the deployment scenario and its parameter adjustment.
Prerequisites for deployment and the test method
In this example, three physical machines are used for deployment, each with 16 CPU cores and 32 GB of memory. On each machine (node), one TiDB instance, one TiKV instance, and one PD instance are deployed in a hybrid way.
Because PD and TiKV both store information on the disk, the read and write latency of disk directly affects the latency of the PD and TiKV services. To avoid the situation that PD and TiKV compete for disk resources and affect each other, it is recommended to use different disks for PD and TiKV.
In this example, the TPC-C 5000 Warehouse data is used in TiUP bench and the test lasts 12 hours with the terminals parameter set to 128 (concurrency). Close attention is paid to metrics related to performance stability of the cluster.
The image below shows the QPS monitor of the cluster within 12 hours with the default parameter configuration. From the image, you can see an obvious performance jitter.
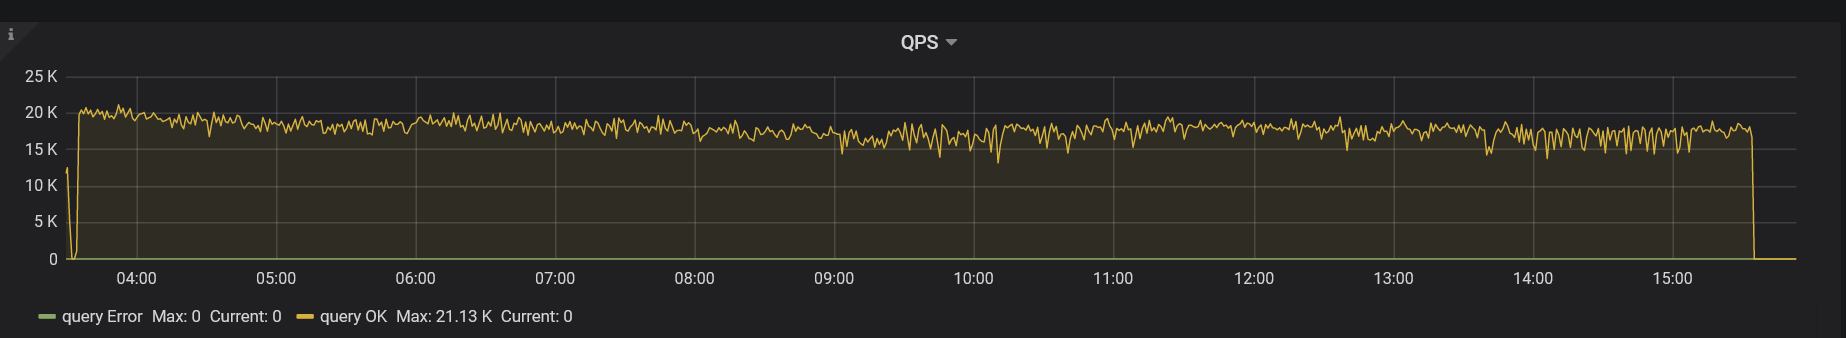
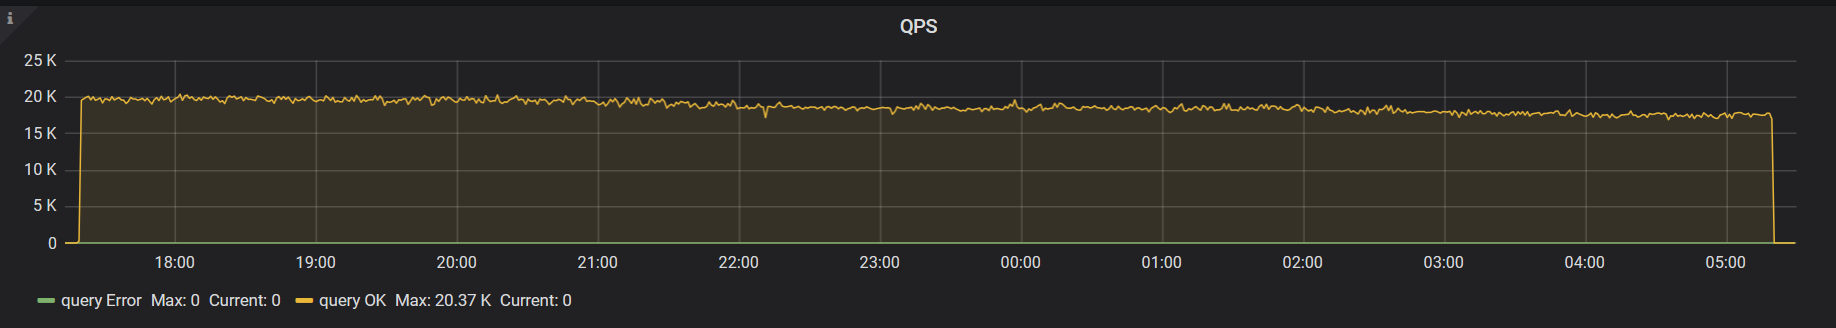
After the parameter adjustment, the performance is improved.
Parameter adjustment
Performance jitter occurs in the image above, because the default thread pool configuration and the resource allocation to background tasks are for machines with sufficient resources. In the hybrid deployment scenario, the resources are shared among multiple components, so you need to limit the resource consumption via configuration parameters.
The final cluster configuration for this test is as follows:
tikv:
    readpool.unified.max-thread-count: 6
    server.grpc-concurrency: 2
    storage.scheduler-worker-pool-size: 2
    gc.max-write-bytes-per-sec: 300K
    rocksdb.max-background-jobs: 3
    rocksdb.max-sub-compactions: 1
    rocksdb.rate-bytes-per-sec: "200M"

  tidb:
    performance.max-procs: 8
The following sections introduce the meanings and the adjustment methods of these parameters.
Configuration of TiKV thread pool size
This section offers best practices for adjusting parameters that relate to the resource allocation of thread pools for foreground applications. Reducing these thread pool sizes will compromise performance, but in the hybrid deployment scenario with limited resources, the cluster itself is hard to achieve high performance. In this scenario, the overall stability of the cluster is preferred over performance.
If you conduct an actual load test, you can first use the default configuration and observe the actual resource usage of each thread pool. Then you can adjust the corresponding configuration items and reduce the sizes of the thread pools that have lower usage.
readpool.unified.max-thread-count
The default value of this parameter is 80% of the number of machine threads. In a hybrid deployment scenario, you need to manually calculate and specify this value. You can first set it to 80% of the expected number of CPU threads used by TiKV.
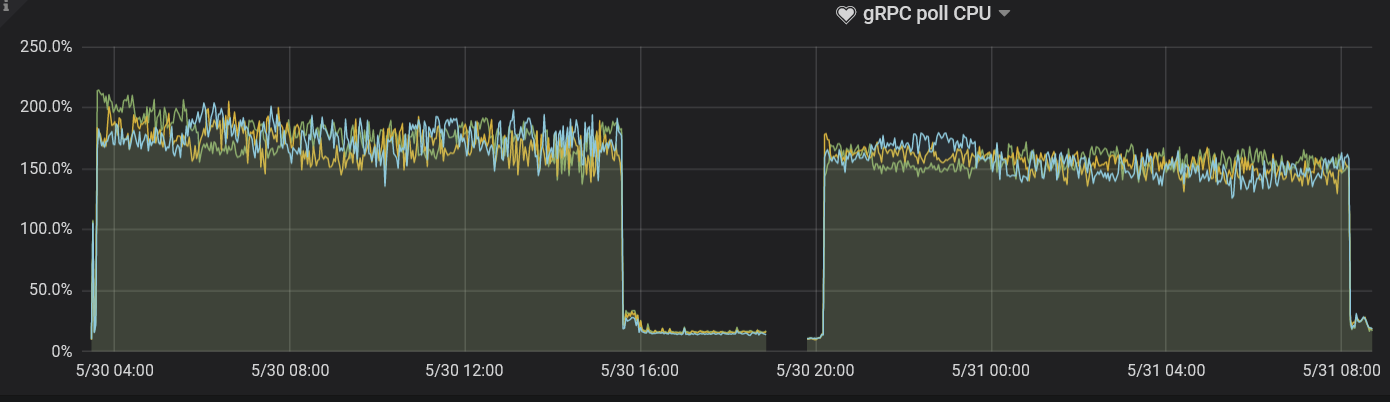
server.grpc-concurrency
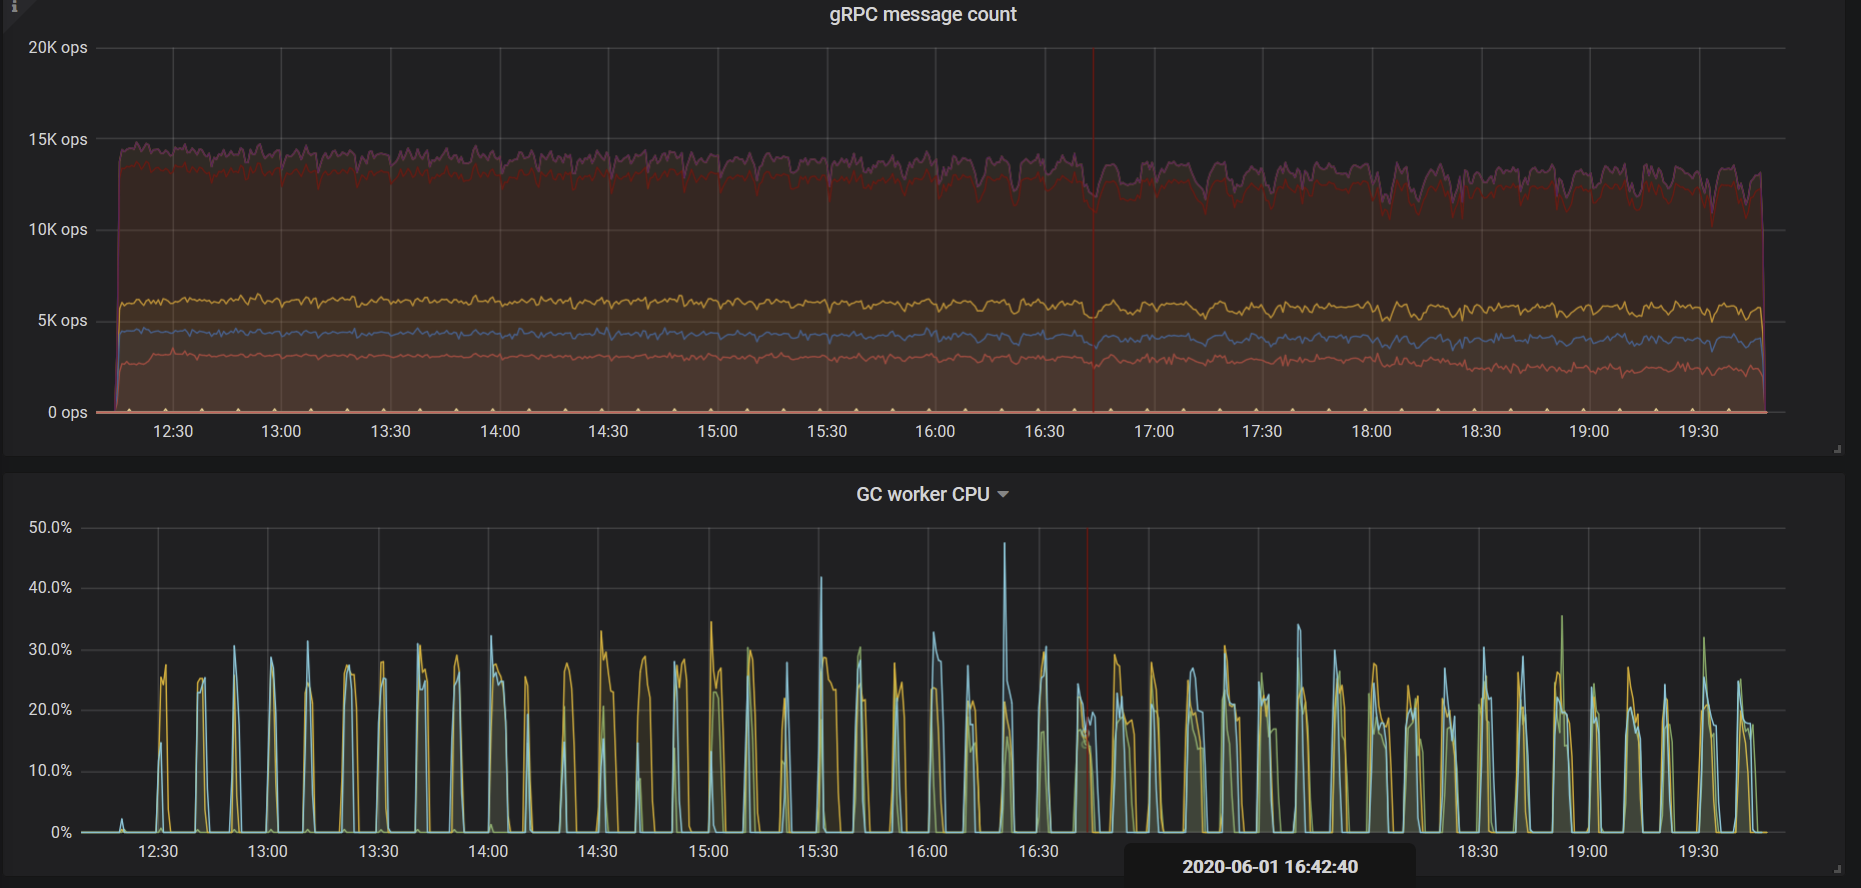
This parameter defaults to 4. Because in the existing deployment plan, the CPU resources are limited and the actual requests are few. You can observe the monitoring panel, lower the value of this parameter, and keep the usage rate below 80%.
In this test, the value of this parameter is set to 2. Observe the gRPC poll CPU panel and you can see that the usage rate is just around 80%.
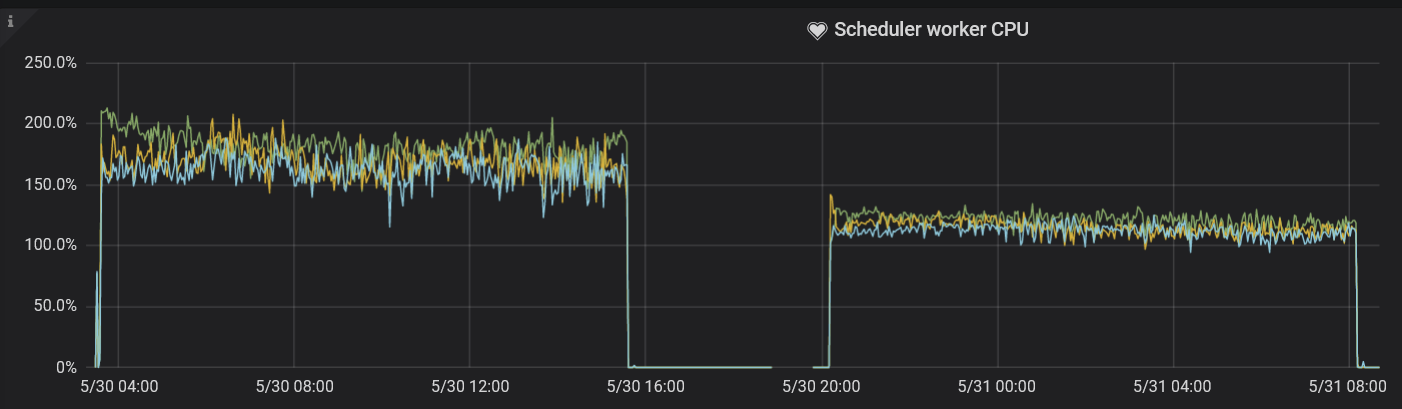
storage.scheduler-worker-pool-size
When TiKV detects that the CPU core number of the machine is greater than or equal to 16, this parameter value defaults to 8. When the CPU core number is smaller than 16, the parameter value defaults to 4. This parameter is used when TiKV converts complex transaction requests to simple key-value reads or writes, but the scheduler thread pool does not performs any writes.
Ideally, the usage rate of the scheduler thread pool is kept between 50% and 75%. Similar to the gRPC thread pool, the storage.scheduler-worker-pool-size parameter defaults to a larger value during the hybrid deployment, which makes resource usage insufficient. In this test, the value of this parameter is set to 2, which is in line with the best practices, a conclusion drawn by observing the corresponding metrics in the Scheduler worker CPU panel.
Resource configuration for TiKV background tasks
In addition to foreground tasks, TiKV regularly sorts data and cleans outdated data in background tasks. The default configuration allocates sufficient resources to these tasks for the scenario of high-traffic writes.
However, in the hybrid deployment scenario, this default configuration is not in line with the best practices. You need to limit the resource usage of background tasks by adjusting the following parameters.
rocksdb.max-background-jobs and rocksdb.max-sub-compactions
The RocksDB thread pool is used to perform compaction and flush jobs. The default value of rocksdb.max-background-jobs is 8, which obviously exceeds the resource that is in need. Therefore, the value should be adjusted to limit the resource usage.
rocksdb.max-sub-compactions indicates the number of concurrent sub-tasks allowed for a single compaction job, which defaults to 3. You can lower this value when the write traffic is not high.
In the test, the rocksdb.max-background-jobs value is set to 3 and the rocksdb.max-sub-compactions value is set to 1. No write stall occurs during the 12-hour test with the TPC-C load. When optimizing the two parameter values according to the actual load, you can lower the values gradually based on monitoring metrics:
- If write stall occurs, increase the value of
rocksdb.max-background-jobs. - If the write stall persists, set the value of
rocksdb.max-sub-compactionsto2or3.
rocksdb.rate-bytes-per-sec
This parameter is used to limit the disk traffic for the background compaction jobs. The default configuration has no limit for this parameter. To avoid the situation that compaction jobs occupy the resources of foreground services, you can adjust this parameter value according to the sequential read and write speed of the disk, which reserves enough disk bandwidth for foreground services.
The method of optimizing the RocksDB thread pool is similar to that of optimizing the compaction thread pool. You can determine whether the value you have adjusted is suitable according to whether write stall occurs.
gc.max_write_bytes_per_sec
Because TiDB uses the multi-version concurrency control (MVCC) model, TiKV periodically cleans old version data in the background. When the available resources are limited, this operation causes periodical performance jitter. You can use the gc.max_write_bytes_per_sec parameter to limit the resource usage of such an operation.
In addition to setting this parameter value in the configuration file, you can also dynamically adjust this value in tikv-ctl.
tiup ctl tikv --host=${ip:port} modify-tikv-config -n gc.max_write_bytes_per_sec -v ${limit}
In application scenarios with frequent updates, limiting GC traffic might cause the MVCC versions to pile up and affect read performance. Currently, to achieve a balance between performance jitter and performance decrease, you might need to try multiple times to adjust the value of this parameter.
TiDB parameter adjustment
Generally, you can adjust the TiDB parameters of execution operators using system variables such as tidb_hash_join_concurrency and tidb_index_lookup_join_concurrency.
In this test, these parameters are not adjusted. In the load test of your actual application, if the execution operators consume an excessive amount of CPU resources, you can limit the resource usage of specific operators according to your application scenario. For more details, see TiDB system variables.
performance.max-procs
This parameter is used to control how many CPU cores an entire Go process can use. By default, the value is equal to the number of CPU cores of the current machine or cgroups.
When Go is running, a proportion of threads is used for background tasks such as GC. If you do not limit the value of the performance.max-procs parameter, these background tasks will consume too much CPU.