- Docs Home
- About TiDB
- Quick Start
- Develop
- Overview
- Quick Start
- Build a TiDB Cluster in TiDB Cloud (Developer Tier)
- CRUD SQL in TiDB
- Build a Simple CRUD App with TiDB
- Example Applications
- Connect to TiDB
- Design Database Schema
- Write Data
- Read Data
- Transaction
- Optimize
- Troubleshoot
- Reference
- Cloud Native Development Environment
- Third-party Support
- Deploy
- Software and Hardware Requirements
- Environment Configuration Checklist
- Plan Cluster Topology
- Install and Start
- Verify Cluster Status
- Test Cluster Performance
- Migrate
- Overview
- Migration Tools
- Migration Scenarios
- Migrate from Aurora
- Migrate MySQL of Small Datasets
- Migrate MySQL of Large Datasets
- Migrate and Merge MySQL Shards of Small Datasets
- Migrate and Merge MySQL Shards of Large Datasets
- Migrate from CSV Files
- Migrate from SQL Files
- Migrate from One TiDB Cluster to Another TiDB Cluster
- Migrate from TiDB to MySQL-compatible Databases
- Advanced Migration
- Integrate
- Maintain
- Monitor and Alert
- Troubleshoot
- TiDB Troubleshooting Map
- Identify Slow Queries
- Analyze Slow Queries
- SQL Diagnostics
- Identify Expensive Queries Using Top SQL
- Identify Expensive Queries Using Logs
- Statement Summary Tables
- Troubleshoot Hotspot Issues
- Troubleshoot Increased Read and Write Latency
- Save and Restore the On-Site Information of a Cluster
- Troubleshoot Cluster Setup
- Troubleshoot High Disk I/O Usage
- Troubleshoot Lock Conflicts
- Troubleshoot TiFlash
- Troubleshoot Write Conflicts in Optimistic Transactions
- Troubleshoot Inconsistency Between Data and Indexes
- Performance Tuning
- Tuning Guide
- Configuration Tuning
- System Tuning
- Software Tuning
- SQL Tuning
- Overview
- Understanding the Query Execution Plan
- SQL Optimization Process
- Overview
- Logic Optimization
- Physical Optimization
- Prepare Execution Plan Cache
- Control Execution Plans
- Tutorials
- TiDB Tools
- Overview
- Use Cases
- Download
- TiUP
- Documentation Map
- Overview
- Terminology and Concepts
- Manage TiUP Components
- FAQ
- Troubleshooting Guide
- Command Reference
- Overview
- TiUP Commands
- TiUP Cluster Commands
- Overview
- tiup cluster audit
- tiup cluster check
- tiup cluster clean
- tiup cluster deploy
- tiup cluster destroy
- tiup cluster disable
- tiup cluster display
- tiup cluster edit-config
- tiup cluster enable
- tiup cluster help
- tiup cluster import
- tiup cluster list
- tiup cluster patch
- tiup cluster prune
- tiup cluster reload
- tiup cluster rename
- tiup cluster replay
- tiup cluster restart
- tiup cluster scale-in
- tiup cluster scale-out
- tiup cluster start
- tiup cluster stop
- tiup cluster template
- tiup cluster upgrade
- TiUP DM Commands
- Overview
- tiup dm audit
- tiup dm deploy
- tiup dm destroy
- tiup dm disable
- tiup dm display
- tiup dm edit-config
- tiup dm enable
- tiup dm help
- tiup dm import
- tiup dm list
- tiup dm patch
- tiup dm prune
- tiup dm reload
- tiup dm replay
- tiup dm restart
- tiup dm scale-in
- tiup dm scale-out
- tiup dm start
- tiup dm stop
- tiup dm template
- tiup dm upgrade
- TiDB Cluster Topology Reference
- DM Cluster Topology Reference
- Mirror Reference Guide
- TiUP Components
- PingCAP Clinic Diagnostic Service
- TiDB Operator
- Dumpling
- TiDB Lightning
- TiDB Data Migration
- About TiDB Data Migration
- Architecture
- Quick Start
- Deploy a DM cluster
- Tutorials
- Advanced Tutorials
- Maintain
- Cluster Upgrade
- Tools
- Performance Tuning
- Manage Data Sources
- Manage Tasks
- Export and Import Data Sources and Task Configurations of Clusters
- Handle Alerts
- Daily Check
- Reference
- Architecture
- Command Line
- Configuration Files
- OpenAPI
- Compatibility Catalog
- Secure
- Monitoring and Alerts
- Error Codes
- Glossary
- Example
- Troubleshoot
- Release Notes
- Backup & Restore (BR)
- TiDB Binlog
- TiCDC
- Dumpling
- sync-diff-inspector
- TiSpark
- Reference
- Cluster Architecture
- Key Monitoring Metrics
- Secure
- Privileges
- SQL
- SQL Language Structure and Syntax
- SQL Statements
ADD COLUMNADD INDEXADMINADMIN CANCEL DDLADMIN CHECKSUM TABLEADMIN CHECK [TABLE|INDEX]ADMIN SHOW DDL [JOBS|QUERIES]ADMIN SHOW TELEMETRYALTER DATABASEALTER INDEXALTER INSTANCEALTER PLACEMENT POLICYALTER TABLEALTER TABLE COMPACTALTER USERANALYZE TABLEBACKUPBATCHBEGINCHANGE COLUMNCOMMITCHANGE DRAINERCHANGE PUMPCREATE [GLOBAL|SESSION] BINDINGCREATE DATABASECREATE INDEXCREATE PLACEMENT POLICYCREATE ROLECREATE SEQUENCECREATE TABLE LIKECREATE TABLECREATE USERCREATE VIEWDEALLOCATEDELETEDESCDESCRIBEDODROP [GLOBAL|SESSION] BINDINGDROP COLUMNDROP DATABASEDROP INDEXDROP PLACEMENT POLICYDROP ROLEDROP SEQUENCEDROP STATSDROP TABLEDROP USERDROP VIEWEXECUTEEXPLAIN ANALYZEEXPLAINFLASHBACK TABLEFLUSH PRIVILEGESFLUSH STATUSFLUSH TABLESGRANT <privileges>GRANT <role>INSERTKILL [TIDB]LOAD DATALOAD STATSMODIFY COLUMNPREPARERECOVER TABLERENAME INDEXRENAME TABLEREPLACERESTOREREVOKE <privileges>REVOKE <role>ROLLBACKSELECTSET DEFAULT ROLESET [NAMES|CHARACTER SET]SET PASSWORDSET ROLESET TRANSACTIONSET [GLOBAL|SESSION] <variable>SHOW ANALYZE STATUSSHOW [BACKUPS|RESTORES]SHOW [GLOBAL|SESSION] BINDINGSSHOW BUILTINSSHOW CHARACTER SETSHOW COLLATIONSHOW [FULL] COLUMNS FROMSHOW CONFIGSHOW CREATE PLACEMENT POLICYSHOW CREATE SEQUENCESHOW CREATE TABLESHOW CREATE USERSHOW DATABASESSHOW DRAINER STATUSSHOW ENGINESSHOW ERRORSSHOW [FULL] FIELDS FROMSHOW GRANTSSHOW INDEX [FROM|IN]SHOW INDEXES [FROM|IN]SHOW KEYS [FROM|IN]SHOW MASTER STATUSSHOW PLACEMENTSHOW PLACEMENT FORSHOW PLACEMENT LABELSSHOW PLUGINSSHOW PRIVILEGESSHOW [FULL] PROCESSSLISTSHOW PROFILESSHOW PUMP STATUSSHOW SCHEMASSHOW STATS_HEALTHYSHOW STATS_HISTOGRAMSSHOW STATS_METASHOW STATUSSHOW TABLE NEXT_ROW_IDSHOW TABLE REGIONSSHOW TABLE STATUSSHOW [FULL] TABLESSHOW [GLOBAL|SESSION] VARIABLESSHOW WARNINGSSHUTDOWNSPLIT REGIONSTART TRANSACTIONTABLETRACETRUNCATEUPDATEUSEWITH
- Data Types
- Functions and Operators
- Overview
- Type Conversion in Expression Evaluation
- Operators
- Control Flow Functions
- String Functions
- Numeric Functions and Operators
- Date and Time Functions
- Bit Functions and Operators
- Cast Functions and Operators
- Encryption and Compression Functions
- Locking Functions
- Information Functions
- JSON Functions
- Aggregate (GROUP BY) Functions
- Window Functions
- Miscellaneous Functions
- Precision Math
- Set Operations
- List of Expressions for Pushdown
- TiDB Specific Functions
- Clustered Indexes
- Constraints
- Generated Columns
- SQL Mode
- Table Attributes
- Transactions
- Garbage Collection (GC)
- Views
- Partitioning
- Temporary Tables
- Cached Tables
- Character Set and Collation
- Placement Rules in SQL
- System Tables
mysql- INFORMATION_SCHEMA
- Overview
ANALYZE_STATUSCLIENT_ERRORS_SUMMARY_BY_HOSTCLIENT_ERRORS_SUMMARY_BY_USERCLIENT_ERRORS_SUMMARY_GLOBALCHARACTER_SETSCLUSTER_CONFIGCLUSTER_HARDWARECLUSTER_INFOCLUSTER_LOADCLUSTER_LOGCLUSTER_SYSTEMINFOCOLLATIONSCOLLATION_CHARACTER_SET_APPLICABILITYCOLUMNSDATA_LOCK_WAITSDDL_JOBSDEADLOCKSENGINESINSPECTION_RESULTINSPECTION_RULESINSPECTION_SUMMARYKEY_COLUMN_USAGEMETRICS_SUMMARYMETRICS_TABLESPARTITIONSPLACEMENT_POLICIESPROCESSLISTREFERENTIAL_CONSTRAINTSSCHEMATASEQUENCESSESSION_VARIABLESSLOW_QUERYSTATISTICSTABLESTABLE_CONSTRAINTSTABLE_STORAGE_STATSTIDB_HOT_REGIONSTIDB_HOT_REGIONS_HISTORYTIDB_INDEXESTIDB_SERVERS_INFOTIDB_TRXTIFLASH_REPLICATIKV_REGION_PEERSTIKV_REGION_STATUSTIKV_STORE_STATUSUSER_PRIVILEGESVIEWS
METRICS_SCHEMA
- UI
- TiDB Dashboard
- Overview
- Maintain
- Access
- Overview Page
- Cluster Info Page
- Top SQL Page
- Key Visualizer Page
- Metrics Relation Graph
- SQL Statements Analysis
- Slow Queries Page
- Cluster Diagnostics
- Search Logs Page
- Instance Profiling
- Session Management and Configuration
- FAQ
- CLI
- Command Line Flags
- Configuration File Parameters
- System Variables
- Storage Engines
- Telemetry
- Errors Codes
- Table Filter
- Schedule Replicas by Topology Labels
- FAQs
- Release Notes
- All Releases
- Release Timeline
- TiDB Versioning
- v6.1
- v6.0
- v5.4
- v5.3
- v5.2
- v5.1
- v5.0
- v4.0
- v3.1
- v3.0
- v2.1
- v2.0
- v1.0
- Glossary
TiDB Dashboard FAQ
This document summarizes the frequently asked questions (FAQs) and answers about TiDB Dashboard. If a problem cannot be located or persists after you perform as instructed, contact PingCAP technical support for help.
Access-related FAQ
When the firewall or reverse proxy is configured, I am redirected to an internal address other than TiDB Dashboard
When multiple Placement Driver (PD) instances are deployed in a cluster, only one of the PD instances actually runs the TiDB Dashboard service. If you access other PD instances instead of this one, your browser redirects you to another address. If the firewall or reverse proxy is not properly configured for accessing TiDB Dashboard, when you visit the Dashboard, you might be redirected to an internal address that is protected by the firewall or reverse proxy.
- See TiDB Dashboard Multi-PD Instance Deployment to learn the working principle of TiDB Dashboard with multiple PD instances.
- See Use TiDB Dashboard through a Reverse Proxy to learn how to correctly configure a reverse proxy.
- See Secure TiDB Dashboard to learn how to correctly configure the firewall.
When TiDB Dashboard is deployed with dual network interface cards (NICs), TiDB Dashboard cannot be accessed using another NIC
For security reasons, TiDB Dashboard on PD only monitors the IP addresses specified during deployment (that is, it only listens on one NIC), not on 0.0.0.0. Therefore, when multiple NICs are installed on the host, you cannot access TiDB Dashboard using another NIC.
If you have deployed TiDB using the tiup cluster or tiup playground command, currently this problem cannot be solved. It is recommended that you use a reverse proxy to safely expose TiDB Dashboard to another NIC. For details, see Use TiDB Dashboard behind a Reverse Proxy.
UI-related FAQ
A prometheus_not_found error is shown in QPS and Latency sections on the Overview page
The QPS and Latency sections on the Overview page require a cluster with Prometheus deployed. Otherwise, the error is shown. You can solve this problem by deploying a Prometheus instance in the cluster.
If you still encounter this problem when the Prometheus instance has been deployed, the possible reason is that your deployment tool is out of date (TiUP or TiDB Operator), and your tool does not automatically report metrics addresses, which makes TiDB Dashboard unable to query metrics. You can upgrade you deployment tool to the latest version and try again.
If your deployment tool is TiUP, take the following steps to solve this problem. For other deployment tools, refer to the corresponding documents of those tools.
Upgrade TiUP and TiUP Cluster:
tiup update --self
tiup update cluster --force
After the upgrade, when a new cluster is deployed with Prometheus instances, the metrics can be displayed normally.
After the upgrade, for an existing cluster, you can restart this cluster to report the metrics addresses. Replace
CLUSTER_NAMEwith the actual cluster name:tiup cluster start CLUSTER_NAMEEven if the cluster has been started, still execute this command. This command does not affect the normal application in the cluster, but refreshes and reports the metrics addresses, so that the monitoring metrics can be displayed normally in TiDB Dashboard.
An invalid connection error is shown on the Slow Queries page
The possible reason is that you have enabled the Prepared Plan Cache feature of TiDB. As an experimental feature, when enabled, Prepared Plan Cache might not function properly in specific TiDB versions, which could cause this problem in TiDB Dashboard (and other applications). You can disable Prepared Plan Cache by setting the system variable tidb_enable_prepared_plan_cache = OFF.
A required component NgMonitoring is not started error is shown
NgMonitoring is an advanced monitoring component built in TiDB clusters of v5.4.0 and later versions to support TiDB Dashboard features such as Continuous Profiling and Top SQL. NgMonitoring is automatically deployed when you deploy or upgrade a cluster with a newer version of TiUP. For clusters deployed using TiDB Operator, you can deploy NgMonitoring manually by referring to Enable Continuous Profiling.
If the web page shows required component NgMonitoring is not started, you can troubleshoot the deployment issue as follows:
Clusters Deployed using TiUP
Step 1. Check versions
Check the TiUP cluster version. NgMonitoring is deployed only when TiUP is v1.9.0 or later.
tiup cluster --versionThe command output shows the TiUP version. For example:
tiup version 1.9.0 tiup
Go Version: go1.17.2
Git Ref: v1.9.0
If the TiUP cluster version is earlier than v1.9.0, upgrade TiUP and TiUP cluster to the latest version:
tiup update --all
Step 2. Add the ng_port configuration item on the control machine by using TiUP. Then reload Prometheus.
Open the cluster configuration file in editing mode:
tiup cluster edit-config ${cluster-name}Under
monitoring_servers, add theng_port:12020parameter:monitoring_servers: - host: 172.16.6.6 ng_port: 12020Reload Prometheus:
tiup cluster reload ${cluster-name} --role prometheus
Please Contact PingCAP Technical Support for help if the error message is still prompted after performing steps above.
Clusters Deployed using TiDB Operator
Deploy the NgMonitoring component by following instructions in the Enable Continuous Profiling section in TiDB Operator documentation.
Clusters Started using TiUP Playground
When starting the cluster, TiUP Playground (>= v1.8.0) automatically starts the NgMonitoring component. To update TiUP Playground to the latest version, run the following command:
tiup update --self
tiup update playground
An unknown field error is shown on the Slow Queries page
If the unknown field error appears on the Slow Queries page after the cluster upgrade, the error is related to a compatibility issue caused by the difference between TiDB Dashboard server fields (which might be updated) and user preferences fields (which are in the browser cache). This issue has been fixed. If your cluster is earlier than v5.0.3 or v4.0.14, perform the following steps to clear your browser cache:
Open TiDB Dashboard page.
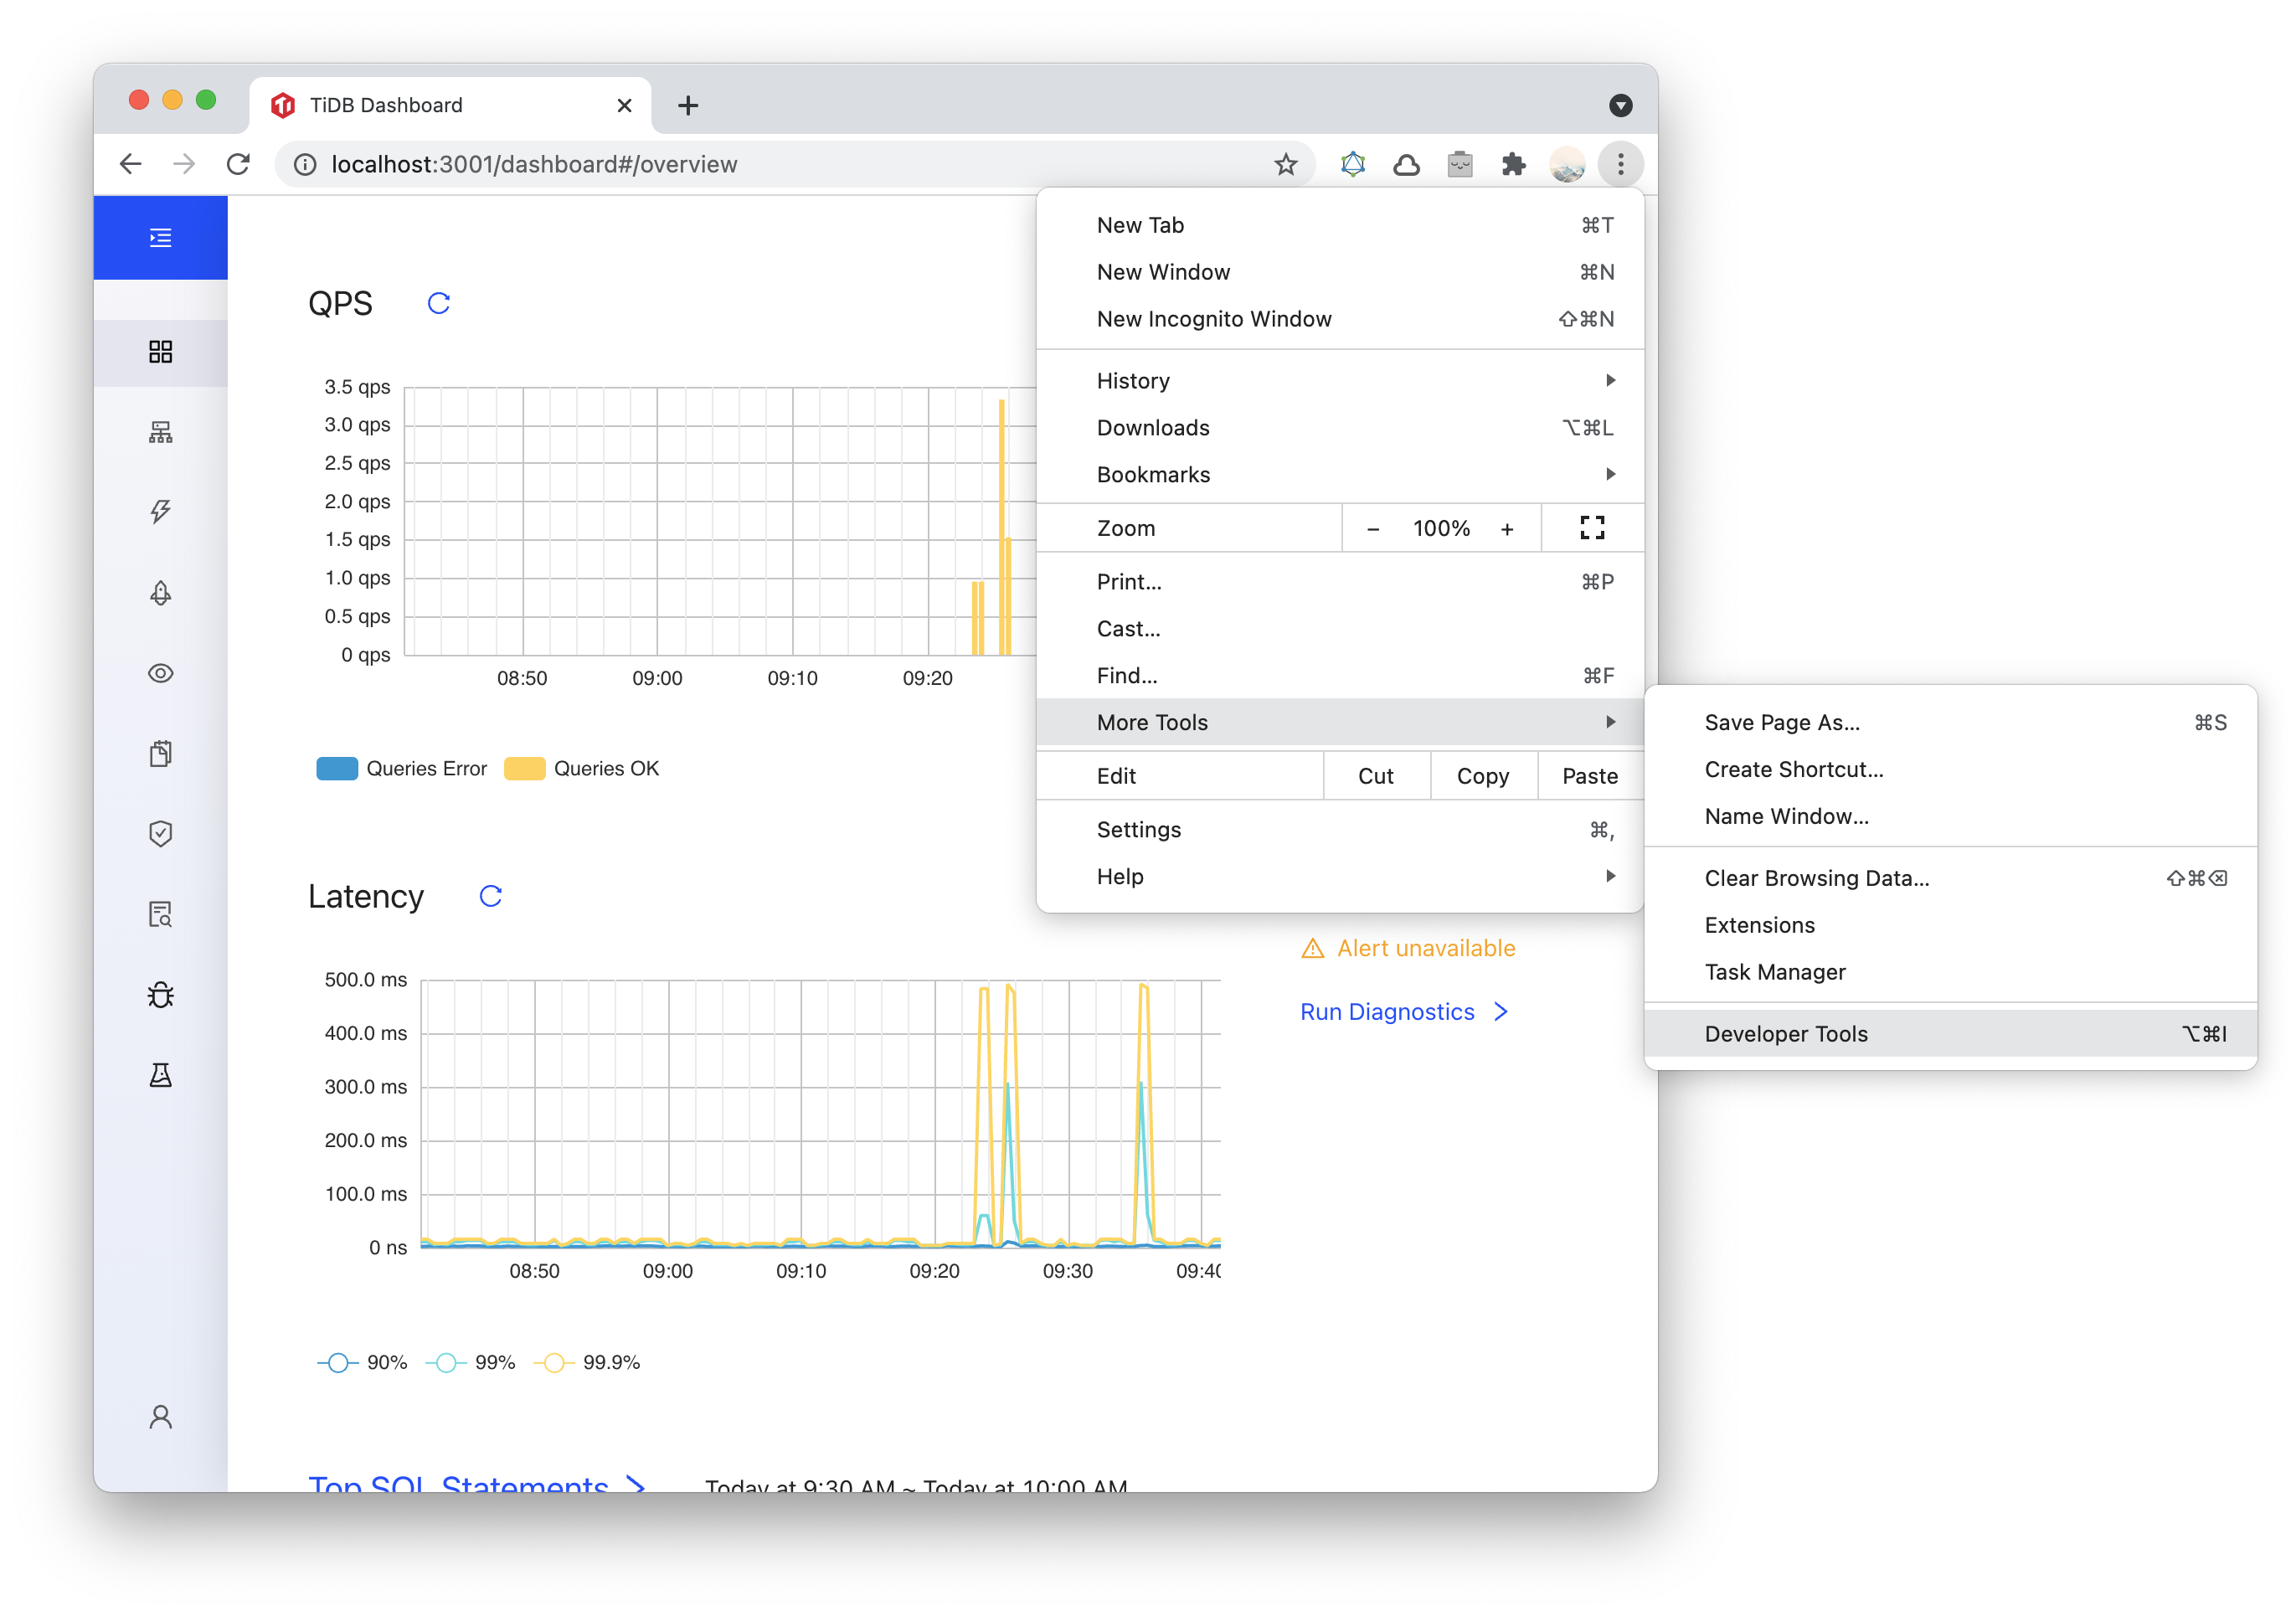
Open Developer Tools. Different browsers have different ways of opening Developer Tools. After clicking the Menu Bar:
- Firefox: Menu > Web Developer > Toggle Tools, or Tools > Web Developer > Toggle Tools.
- Chrome: More tools > Developer tools.
- Safari: Develop > Show Web Inspector. If you can't see the Develop menu, go to Safari > Preferences > Advanced, and check the Show Develop menu in menu bar checkbox.
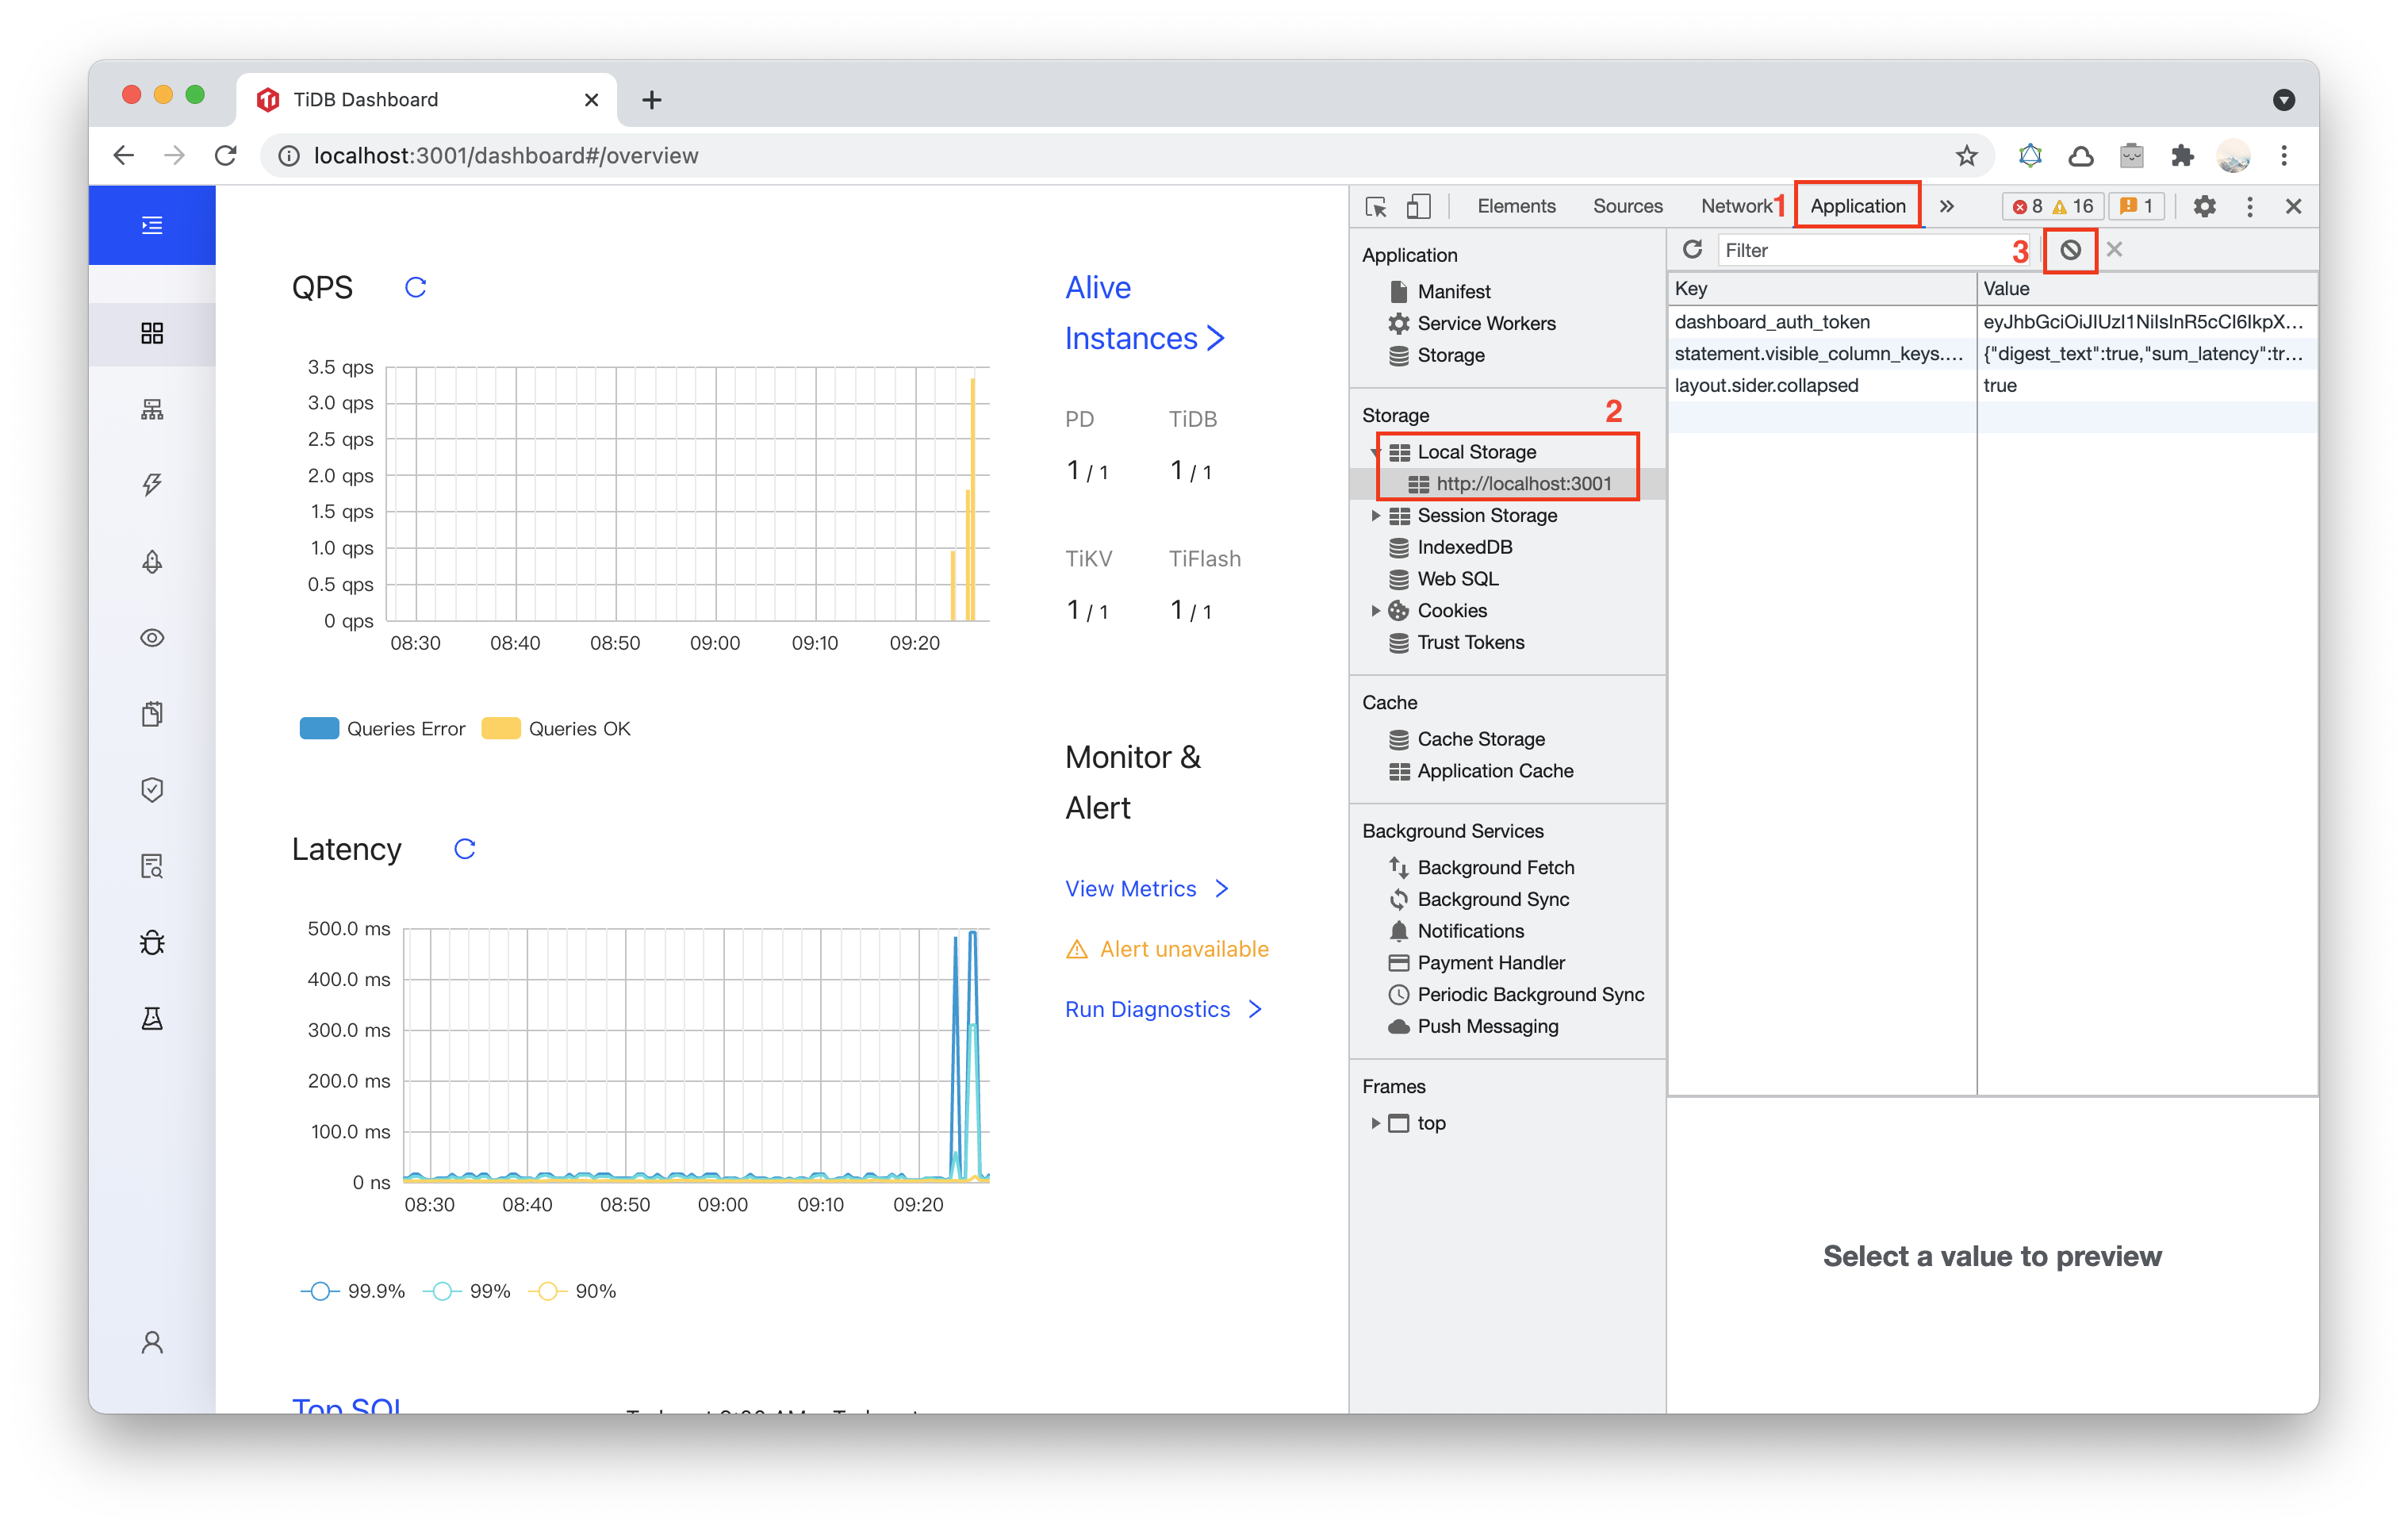
In the following example, Chrome is used.
Select the Application panel, expand the Local Storage menu and select the TiDB Dashboard page domain. Click the Clear All button.