- Docs Home
- About TiDB
- Quick Start
- Develop
- Overview
- Quick Start
- Build a TiDB Cluster in TiDB Cloud (Developer Tier)
- CRUD SQL in TiDB
- Build a Simple CRUD App with TiDB
- Example Applications
- Connect to TiDB
- Design Database Schema
- Write Data
- Read Data
- Transaction
- Optimize
- Troubleshoot
- Reference
- Cloud Native Development Environment
- Third-party Support
- Deploy
- Software and Hardware Requirements
- Environment Configuration Checklist
- Plan Cluster Topology
- Install and Start
- Verify Cluster Status
- Test Cluster Performance
- Migrate
- Overview
- Migration Tools
- Migration Scenarios
- Migrate from Aurora
- Migrate MySQL of Small Datasets
- Migrate MySQL of Large Datasets
- Migrate and Merge MySQL Shards of Small Datasets
- Migrate and Merge MySQL Shards of Large Datasets
- Migrate from CSV Files
- Migrate from SQL Files
- Migrate from One TiDB Cluster to Another TiDB Cluster
- Migrate from TiDB to MySQL-compatible Databases
- Advanced Migration
- Integrate
- Maintain
- Monitor and Alert
- Troubleshoot
- TiDB Troubleshooting Map
- Identify Slow Queries
- Analyze Slow Queries
- SQL Diagnostics
- Identify Expensive Queries Using Top SQL
- Identify Expensive Queries Using Logs
- Statement Summary Tables
- Troubleshoot Hotspot Issues
- Troubleshoot Increased Read and Write Latency
- Save and Restore the On-Site Information of a Cluster
- Troubleshoot Cluster Setup
- Troubleshoot High Disk I/O Usage
- Troubleshoot Lock Conflicts
- Troubleshoot TiFlash
- Troubleshoot Write Conflicts in Optimistic Transactions
- Troubleshoot Inconsistency Between Data and Indexes
- Performance Tuning
- Tuning Guide
- Configuration Tuning
- System Tuning
- Software Tuning
- SQL Tuning
- Overview
- Understanding the Query Execution Plan
- SQL Optimization Process
- Overview
- Logic Optimization
- Physical Optimization
- Prepare Execution Plan Cache
- Control Execution Plans
- Tutorials
- TiDB Tools
- Overview
- Use Cases
- Download
- TiUP
- Documentation Map
- Overview
- Terminology and Concepts
- Manage TiUP Components
- FAQ
- Troubleshooting Guide
- Command Reference
- Overview
- TiUP Commands
- TiUP Cluster Commands
- Overview
- tiup cluster audit
- tiup cluster check
- tiup cluster clean
- tiup cluster deploy
- tiup cluster destroy
- tiup cluster disable
- tiup cluster display
- tiup cluster edit-config
- tiup cluster enable
- tiup cluster help
- tiup cluster import
- tiup cluster list
- tiup cluster patch
- tiup cluster prune
- tiup cluster reload
- tiup cluster rename
- tiup cluster replay
- tiup cluster restart
- tiup cluster scale-in
- tiup cluster scale-out
- tiup cluster start
- tiup cluster stop
- tiup cluster template
- tiup cluster upgrade
- TiUP DM Commands
- Overview
- tiup dm audit
- tiup dm deploy
- tiup dm destroy
- tiup dm disable
- tiup dm display
- tiup dm edit-config
- tiup dm enable
- tiup dm help
- tiup dm import
- tiup dm list
- tiup dm patch
- tiup dm prune
- tiup dm reload
- tiup dm replay
- tiup dm restart
- tiup dm scale-in
- tiup dm scale-out
- tiup dm start
- tiup dm stop
- tiup dm template
- tiup dm upgrade
- TiDB Cluster Topology Reference
- DM Cluster Topology Reference
- Mirror Reference Guide
- TiUP Components
- PingCAP Clinic Diagnostic Service
- TiDB Operator
- Dumpling
- TiDB Lightning
- TiDB Data Migration
- About TiDB Data Migration
- Architecture
- Quick Start
- Deploy a DM cluster
- Tutorials
- Advanced Tutorials
- Maintain
- Cluster Upgrade
- Tools
- Performance Tuning
- Manage Data Sources
- Manage Tasks
- Export and Import Data Sources and Task Configurations of Clusters
- Handle Alerts
- Daily Check
- Reference
- Architecture
- Command Line
- Configuration Files
- OpenAPI
- Compatibility Catalog
- Secure
- Monitoring and Alerts
- Error Codes
- Glossary
- Example
- Troubleshoot
- Release Notes
- Backup & Restore (BR)
- TiDB Binlog
- TiCDC
- Dumpling
- sync-diff-inspector
- TiSpark
- Reference
- Cluster Architecture
- Key Monitoring Metrics
- Secure
- Privileges
- SQL
- SQL Language Structure and Syntax
- SQL Statements
ADD COLUMNADD INDEXADMINADMIN CANCEL DDLADMIN CHECKSUM TABLEADMIN CHECK [TABLE|INDEX]ADMIN SHOW DDL [JOBS|QUERIES]ADMIN SHOW TELEMETRYALTER DATABASEALTER INDEXALTER INSTANCEALTER PLACEMENT POLICYALTER TABLEALTER TABLE COMPACTALTER USERANALYZE TABLEBACKUPBATCHBEGINCHANGE COLUMNCOMMITCHANGE DRAINERCHANGE PUMPCREATE [GLOBAL|SESSION] BINDINGCREATE DATABASECREATE INDEXCREATE PLACEMENT POLICYCREATE ROLECREATE SEQUENCECREATE TABLE LIKECREATE TABLECREATE USERCREATE VIEWDEALLOCATEDELETEDESCDESCRIBEDODROP [GLOBAL|SESSION] BINDINGDROP COLUMNDROP DATABASEDROP INDEXDROP PLACEMENT POLICYDROP ROLEDROP SEQUENCEDROP STATSDROP TABLEDROP USERDROP VIEWEXECUTEEXPLAIN ANALYZEEXPLAINFLASHBACK TABLEFLUSH PRIVILEGESFLUSH STATUSFLUSH TABLESGRANT <privileges>GRANT <role>INSERTKILL [TIDB]LOAD DATALOAD STATSMODIFY COLUMNPREPARERECOVER TABLERENAME INDEXRENAME TABLEREPLACERESTOREREVOKE <privileges>REVOKE <role>ROLLBACKSELECTSET DEFAULT ROLESET [NAMES|CHARACTER SET]SET PASSWORDSET ROLESET TRANSACTIONSET [GLOBAL|SESSION] <variable>SHOW ANALYZE STATUSSHOW [BACKUPS|RESTORES]SHOW [GLOBAL|SESSION] BINDINGSSHOW BUILTINSSHOW CHARACTER SETSHOW COLLATIONSHOW [FULL] COLUMNS FROMSHOW CONFIGSHOW CREATE PLACEMENT POLICYSHOW CREATE SEQUENCESHOW CREATE TABLESHOW CREATE USERSHOW DATABASESSHOW DRAINER STATUSSHOW ENGINESSHOW ERRORSSHOW [FULL] FIELDS FROMSHOW GRANTSSHOW INDEX [FROM|IN]SHOW INDEXES [FROM|IN]SHOW KEYS [FROM|IN]SHOW MASTER STATUSSHOW PLACEMENTSHOW PLACEMENT FORSHOW PLACEMENT LABELSSHOW PLUGINSSHOW PRIVILEGESSHOW [FULL] PROCESSSLISTSHOW PROFILESSHOW PUMP STATUSSHOW SCHEMASSHOW STATS_HEALTHYSHOW STATS_HISTOGRAMSSHOW STATS_METASHOW STATUSSHOW TABLE NEXT_ROW_IDSHOW TABLE REGIONSSHOW TABLE STATUSSHOW [FULL] TABLESSHOW [GLOBAL|SESSION] VARIABLESSHOW WARNINGSSHUTDOWNSPLIT REGIONSTART TRANSACTIONTABLETRACETRUNCATEUPDATEUSEWITH
- Data Types
- Functions and Operators
- Overview
- Type Conversion in Expression Evaluation
- Operators
- Control Flow Functions
- String Functions
- Numeric Functions and Operators
- Date and Time Functions
- Bit Functions and Operators
- Cast Functions and Operators
- Encryption and Compression Functions
- Locking Functions
- Information Functions
- JSON Functions
- Aggregate (GROUP BY) Functions
- Window Functions
- Miscellaneous Functions
- Precision Math
- Set Operations
- List of Expressions for Pushdown
- TiDB Specific Functions
- Clustered Indexes
- Constraints
- Generated Columns
- SQL Mode
- Table Attributes
- Transactions
- Garbage Collection (GC)
- Views
- Partitioning
- Temporary Tables
- Cached Tables
- Character Set and Collation
- Placement Rules in SQL
- System Tables
mysql- INFORMATION_SCHEMA
- Overview
ANALYZE_STATUSCLIENT_ERRORS_SUMMARY_BY_HOSTCLIENT_ERRORS_SUMMARY_BY_USERCLIENT_ERRORS_SUMMARY_GLOBALCHARACTER_SETSCLUSTER_CONFIGCLUSTER_HARDWARECLUSTER_INFOCLUSTER_LOADCLUSTER_LOGCLUSTER_SYSTEMINFOCOLLATIONSCOLLATION_CHARACTER_SET_APPLICABILITYCOLUMNSDATA_LOCK_WAITSDDL_JOBSDEADLOCKSENGINESINSPECTION_RESULTINSPECTION_RULESINSPECTION_SUMMARYKEY_COLUMN_USAGEMETRICS_SUMMARYMETRICS_TABLESPARTITIONSPLACEMENT_POLICIESPROCESSLISTREFERENTIAL_CONSTRAINTSSCHEMATASEQUENCESSESSION_VARIABLESSLOW_QUERYSTATISTICSTABLESTABLE_CONSTRAINTSTABLE_STORAGE_STATSTIDB_HOT_REGIONSTIDB_HOT_REGIONS_HISTORYTIDB_INDEXESTIDB_SERVERS_INFOTIDB_TRXTIFLASH_REPLICATIKV_REGION_PEERSTIKV_REGION_STATUSTIKV_STORE_STATUSUSER_PRIVILEGESVIEWS
METRICS_SCHEMA
- UI
- TiDB Dashboard
- Overview
- Maintain
- Access
- Overview Page
- Cluster Info Page
- Top SQL Page
- Key Visualizer Page
- Metrics Relation Graph
- SQL Statements Analysis
- Slow Queries Page
- Cluster Diagnostics
- Search Logs Page
- Instance Profiling
- Session Management and Configuration
- FAQ
- CLI
- Command Line Flags
- Configuration File Parameters
- System Variables
- Storage Engines
- Telemetry
- Errors Codes
- Table Filter
- Schedule Replicas by Topology Labels
- FAQs
- Release Notes
- All Releases
- Release Timeline
- TiDB Versioning
- v6.1
- v6.0
- v5.4
- v5.3
- v5.2
- v5.1
- v5.0
- v4.0
- v3.1
- v3.0
- v2.1
- v2.0
- v1.0
- Glossary
EXPLAIN
The EXPLAIN statement shows the execution plan for a query without executing it. It is complimented by EXPLAIN ANALYZE which will execute the query. If the output of EXPLAIN does not match the expected result, consider executing ANALYZE TABLE on each table in the query.
The statements DESC and DESCRIBE are aliases of this statement. The alternative usage of EXPLAIN <tableName> is documented under SHOW [FULL] COLUMNS FROM.
TiDB supports the EXPLAIN [options] FOR CONNECTION connection_id statement. However, this statement is different from the EXPLAIN FOR statement in MySQL. For more details, see EXPLAIN FOR CONNECTION.
Synopsis
- ExplainSym
- ExplainStmt
- ExplainableStmt
ExplainSym ::=
    'EXPLAIN'
|   'DESCRIBE'
|   'DESC'

ExplainStmt ::=
    ExplainSym ( TableName ColumnName? | 'ANALYZE'? ExplainableStmt | 'FOR' 'CONNECTION' NUM | 'FORMAT' '=' ( stringLit | ExplainFormatType ) ( 'FOR' 'CONNECTION' NUM | ExplainableStmt ) )

ExplainableStmt ::=
    SelectStmt
|   DeleteFromStmt
|   UpdateStmt
|   InsertIntoStmt
|   ReplaceIntoStmt
|   UnionStmt
EXPLAIN output format
When you use the MySQL client to connect to TiDB, to read the output result in a clearer way without line wrapping, you can use the pager less -S command. Then, after the EXPLAIN result is output, you can press the right arrow → button on your keyboard to horizontally scroll through the output.
Currently, EXPLAIN in TiDB outputs 5 columns: id, estRows, task, access object, operator info. Each operator in the execution plan is described by these attributes, with each row in the EXPLAIN output describing an operator. The description of each attribute is as follows:
| Attribute name | Description |
|---|---|
| id | The operator ID is the unique identifier of the operator in the entire execution plan. In TiDB 2.1, the ID is formatted to display the tree structure of the operator. Data flows from the child node to the parent node. One and only one parent node for each operator. |
| estRows | The number of rows that the operator is expected to output. This number is estimated according to the statistics and the operator's logic. estRows is called count in the earlier versions of TiDB 4.0. |
| task | The type of task the operator belongs to. Currently, the execution plans are divided into two tasks: root task, which is executed on tidb-server, and cop task, which is performed in parallel on TiKV or TiFlash. The topology of the execution plan at the task level is that a root task followed by many cop tasks. The root task uses the output of cop tasks as input. The cop tasks refer to tasks that TiDB pushes down to TiKV or TiFlash. Each cop task is distributed in the TiKV cluster or the TiFlash cluster, and is executed by multiple processes. |
| access object | Data item information accessed by the operator. The information includes table, partition, and index (if any). Only operators that directly access the data have such information. |
| operator info | Other information about the operator. operator info of each operator is different. You can refer to the following examples. |
Examples
EXPLAIN SELECT 1;
+-------------------+---------+------+---------------+---------------+
| id                | estRows | task | access object | operator info |
+-------------------+---------+------+---------------+---------------+
| Projection_3      | 1.00    | root |               | 1->Column#1   |
| └─TableDual_4     | 1.00    | root |               | rows:1        |
+-------------------+---------+------+---------------+---------------+
2 rows in set (0.00 sec)
CREATE TABLE t1 (id INT NOT NULL PRIMARY KEY AUTO_INCREMENT, c1 INT NOT NULL);
Query OK, 0 rows affected (0.10 sec)
INSERT INTO t1 (c1) VALUES (1), (2), (3);
Query OK, 3 rows affected (0.02 sec)
Records: 3  Duplicates: 0  Warnings: 0
EXPLAIN SELECT * FROM t1 WHERE id = 1;
+-------------+---------+------+---------------+---------------+
| id          | estRows | task | access object | operator info |
+-------------+---------+------+---------------+---------------+
| Point_Get_1 | 1.00    | root | table:t1      | handle:1      |
+-------------+---------+------+---------------+---------------+
1 row in set (0.00 sec)
DESC SELECT * FROM t1 WHERE id = 1;
+-------------+---------+------+---------------+---------------+
| id          | estRows | task | access object | operator info |
+-------------+---------+------+---------------+---------------+
| Point_Get_1 | 1.00    | root | table:t1      | handle:1      |
+-------------+---------+------+---------------+---------------+
1 row in set (0.00 sec)
DESCRIBE SELECT * FROM t1 WHERE id = 1;
+-------------+---------+------+---------------+---------------+
| id          | estRows | task | access object | operator info |
+-------------+---------+------+---------------+---------------+
| Point_Get_1 | 1.00    | root | table:t1      | handle:1      |
+-------------+---------+------+---------------+---------------+
1 row in set (0.00 sec)
EXPLAIN INSERT INTO t1 (c1) VALUES (4);
+----------+---------+------+---------------+---------------+
| id       | estRows | task | access object | operator info |
+----------+---------+------+---------------+---------------+
| Insert_1 | N/A     | root |               | N/A           |
+----------+---------+------+---------------+---------------+
1 row in set (0.00 sec)
EXPLAIN UPDATE t1 SET c1=5 WHERE c1=3;
+---------------------------+---------+-----------+---------------+--------------------------------+
| id                        | estRows | task      | access object | operator info                  |
+---------------------------+---------+-----------+---------------+--------------------------------+
| Update_4                  | N/A     | root      |               | N/A                            |
| └─TableReader_8           | 0.00    | root      |               | data:Selection_7               |
|   └─Selection_7           | 0.00    | cop[tikv] |               | eq(test.t1.c1, 3)              |
|     └─TableFullScan_6     | 3.00    | cop[tikv] | table:t1      | keep order:false, stats:pseudo |
+---------------------------+---------+-----------+---------------+--------------------------------+
4 rows in set (0.00 sec)
EXPLAIN DELETE FROM t1 WHERE c1=3;
+---------------------------+---------+-----------+---------------+--------------------------------+
| id                        | estRows | task      | access object | operator info                  |
+---------------------------+---------+-----------+---------------+--------------------------------+
| Delete_4                  | N/A     | root      |               | N/A                            |
| └─TableReader_8           | 0.00    | root      |               | data:Selection_7               |
|   └─Selection_7           | 0.00    | cop[tikv] |               | eq(test.t1.c1, 3)              |
|     └─TableFullScan_6     | 3.00    | cop[tikv] | table:t1      | keep order:false, stats:pseudo |
+---------------------------+---------+-----------+---------------+--------------------------------+
4 rows in set (0.01 sec)
To specify the content and format of the output, you can use the FORMAT = xxx syntax in the EXPLAIN statement.
If you do not specify the FORMAT in EXPLAIN, or specify FORMAT = "row", EXPLAIN statement will output the results in a tabular format. See Understand the Query Execution Plan for more information.
If you specify FORMAT = "brief" in EXPLAIN, the operator IDs in the output are simplified compared with that without FORMAT specified.
EXPLAIN FORMAT = "brief" DELETE FROM t1 WHERE c1 = 3;
+-------------------------+---------+-----------+---------------+--------------------------------+
| id                      | estRows | task      | access object | operator info                  |
+-------------------------+---------+-----------+---------------+--------------------------------+
| Delete                  | N/A     | root      |               | N/A                            |
| └─TableReader           | 0.00    | root      |               | data:Selection                 |
|   └─Selection           | 0.00    | cop[tikv] |               | eq(test.t1.c1, 3)              |
|     └─TableFullScan     | 3.00    | cop[tikv] | table:t1      | keep order:false, stats:pseudo |
+-------------------------+---------+-----------+---------------+--------------------------------+
4 rows in set (0.001 sec)
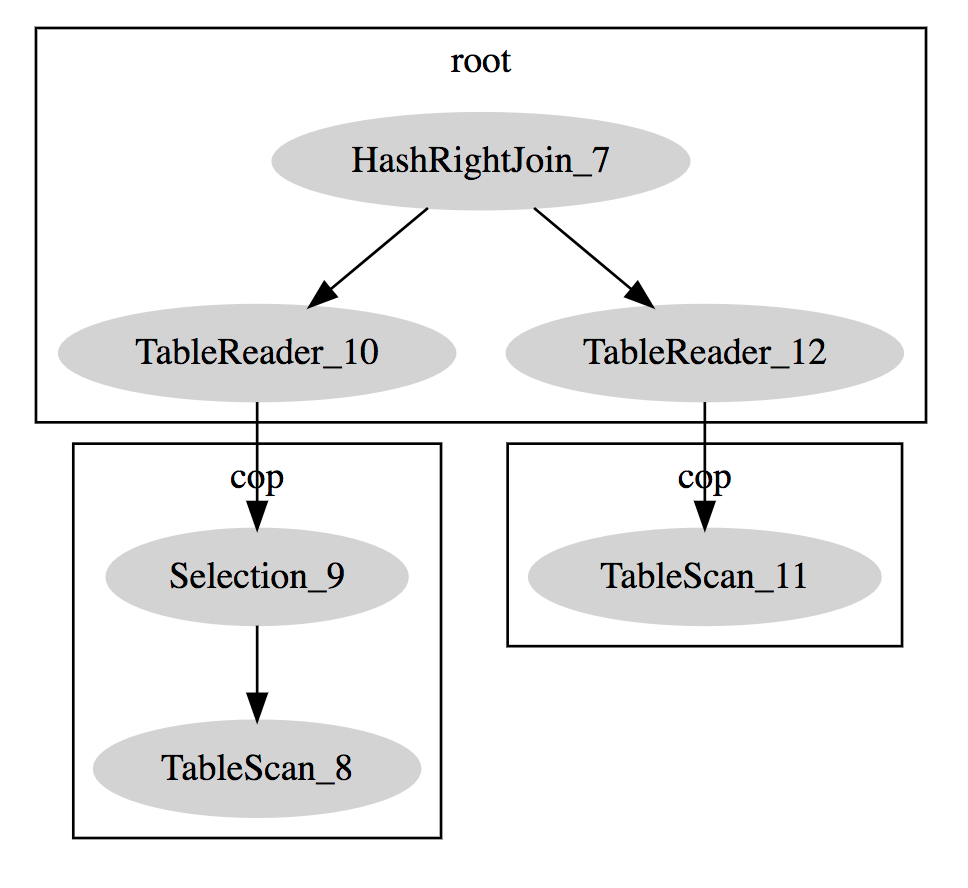
In addition to the MySQL standard result format, TiDB also supports DotGraph and you need to specify FORMAT = "dot" as in the following example:
create table t(a bigint, b bigint);
desc format = "dot" select A.a, B.b from t A join t B on A.a > B.b where A.a < 10;
+-----------------------------------------------------------------------------------------------------------------------------------------------------------------------------------------------------------------------------------------------------------------------------------------------------------------------------------------------------------------------------------------------------------------------------------------------------------------------------------------------------------------------------------------------------------------------------+
| dot contents                                                                                                                                                                                                                                                                                                                                                                                                                                                                                                                                                                |
+-----------------------------------------------------------------------------------------------------------------------------------------------------------------------------------------------------------------------------------------------------------------------------------------------------------------------------------------------------------------------------------------------------------------------------------------------------------------------------------------------------------------------------------------------------------------------------+
|
digraph Projection_8 {
subgraph cluster8{
node [style=filled, color=lightgrey]
color=black
label = "root"
"Projection_8" -> "HashJoin_9"
"HashJoin_9" -> "TableReader_13"
"HashJoin_9" -> "Selection_14"
"Selection_14" -> "TableReader_17"
}
subgraph cluster12{
node [style=filled, color=lightgrey]
color=black
label = "cop"
"Selection_12" -> "TableFullScan_11"
}
subgraph cluster16{
node [style=filled, color=lightgrey]
color=black
label = "cop"
"Selection_16" -> "TableFullScan_15"
}
"TableReader_13" -> "Selection_12"
"TableReader_17" -> "Selection_16"
}
 |
+-----------------------------------------------------------------------------------------------------------------------------------------------------------------------------------------------------------------------------------------------------------------------------------------------------------------------------------------------------------------------------------------------------------------------------------------------------------------------------------------------------------------------------------------------------------------------------+
1 row in set (0.00 sec)
If the dot program (in the graphviz package) is installed on your computer, you can generate a PNG file using the following method:
dot xx.dot -T png -O

The xx.dot is the result returned by the above statement.
If the dot program is not installed on your computer, copy the result to this website to get a tree diagram:
MySQL compatibility
- Both the format of
EXPLAINand the potential execution plans in TiDB differ substaintially from MySQL. - TiDB does not support the
FORMAT=JSONorFORMAT=TREEoptions.
EXPLAIN FOR CONNECTION
EXPLAIN FOR CONNECTION is used to get the execution plan of the currently executed SQL query or the last executed SQL query in a connection. The output format is the same as that of EXPLAIN. However, the implementation of EXPLAIN FOR CONNECTION in TiDB is different from that in MySQL. Their differences (apart from the output format) are listed as follows:
- MySQL returns the query plan that is being executing, while TiDB returns the last executed query plan.
- MySQL requires the login user to be the same as the connection being queried, or the login user has the
PROCESSprivilege; while TiDB requires the login user to be the same as the connection being queried, or the login user has theSUPERprivilege.