- Docs Home
- About TiDB
- Quick Start
- Develop
- Overview
- Quick Start
- Build a TiDB Cluster in TiDB Cloud (Developer Tier)
- CRUD SQL in TiDB
- Build a Simple CRUD App with TiDB
- Example Applications
- Connect to TiDB
- Design Database Schema
- Write Data
- Read Data
- Transaction
- Optimize
- Troubleshoot
- Reference
- Cloud Native Development Environment
- Third-party Support
- Deploy
- Software and Hardware Requirements
- Environment Configuration Checklist
- Plan Cluster Topology
- Install and Start
- Verify Cluster Status
- Test Cluster Performance
- Migrate
- Overview
- Migration Tools
- Migration Scenarios
- Migrate from Aurora
- Migrate MySQL of Small Datasets
- Migrate MySQL of Large Datasets
- Migrate and Merge MySQL Shards of Small Datasets
- Migrate and Merge MySQL Shards of Large Datasets
- Migrate from CSV Files
- Migrate from SQL Files
- Migrate from One TiDB Cluster to Another TiDB Cluster
- Migrate from TiDB to MySQL-compatible Databases
- Advanced Migration
- Integrate
- Maintain
- Monitor and Alert
- Troubleshoot
- TiDB Troubleshooting Map
- Identify Slow Queries
- Analyze Slow Queries
- SQL Diagnostics
- Identify Expensive Queries Using Top SQL
- Identify Expensive Queries Using Logs
- Statement Summary Tables
- Troubleshoot Hotspot Issues
- Troubleshoot Increased Read and Write Latency
- Save and Restore the On-Site Information of a Cluster
- Troubleshoot Cluster Setup
- Troubleshoot High Disk I/O Usage
- Troubleshoot Lock Conflicts
- Troubleshoot TiFlash
- Troubleshoot Write Conflicts in Optimistic Transactions
- Troubleshoot Inconsistency Between Data and Indexes
- Performance Tuning
- Tuning Guide
- Configuration Tuning
- System Tuning
- Software Tuning
- SQL Tuning
- Overview
- Understanding the Query Execution Plan
- SQL Optimization Process
- Overview
- Logic Optimization
- Physical Optimization
- Prepare Execution Plan Cache
- Control Execution Plans
- Tutorials
- TiDB Tools
- Overview
- Use Cases
- Download
- TiUP
- Documentation Map
- Overview
- Terminology and Concepts
- Manage TiUP Components
- FAQ
- Troubleshooting Guide
- Command Reference
- Overview
- TiUP Commands
- TiUP Cluster Commands
- Overview
- tiup cluster audit
- tiup cluster check
- tiup cluster clean
- tiup cluster deploy
- tiup cluster destroy
- tiup cluster disable
- tiup cluster display
- tiup cluster edit-config
- tiup cluster enable
- tiup cluster help
- tiup cluster import
- tiup cluster list
- tiup cluster patch
- tiup cluster prune
- tiup cluster reload
- tiup cluster rename
- tiup cluster replay
- tiup cluster restart
- tiup cluster scale-in
- tiup cluster scale-out
- tiup cluster start
- tiup cluster stop
- tiup cluster template
- tiup cluster upgrade
- TiUP DM Commands
- Overview
- tiup dm audit
- tiup dm deploy
- tiup dm destroy
- tiup dm disable
- tiup dm display
- tiup dm edit-config
- tiup dm enable
- tiup dm help
- tiup dm import
- tiup dm list
- tiup dm patch
- tiup dm prune
- tiup dm reload
- tiup dm replay
- tiup dm restart
- tiup dm scale-in
- tiup dm scale-out
- tiup dm start
- tiup dm stop
- tiup dm template
- tiup dm upgrade
- TiDB Cluster Topology Reference
- DM Cluster Topology Reference
- Mirror Reference Guide
- TiUP Components
- PingCAP Clinic Diagnostic Service
- TiDB Operator
- Dumpling
- TiDB Lightning
- TiDB Data Migration
- About TiDB Data Migration
- Architecture
- Quick Start
- Deploy a DM cluster
- Tutorials
- Advanced Tutorials
- Maintain
- Cluster Upgrade
- Tools
- Performance Tuning
- Manage Data Sources
- Manage Tasks
- Export and Import Data Sources and Task Configurations of Clusters
- Handle Alerts
- Daily Check
- Reference
- Architecture
- Command Line
- Configuration Files
- OpenAPI
- Compatibility Catalog
- Secure
- Monitoring and Alerts
- Error Codes
- Glossary
- Example
- Troubleshoot
- Release Notes
- Backup & Restore (BR)
- TiDB Binlog
- TiCDC
- Dumpling
- sync-diff-inspector
- TiSpark
- Reference
- Cluster Architecture
- Key Monitoring Metrics
- Secure
- Privileges
- SQL
- SQL Language Structure and Syntax
- SQL Statements
ADD COLUMNADD INDEXADMINADMIN CANCEL DDLADMIN CHECKSUM TABLEADMIN CHECK [TABLE|INDEX]ADMIN SHOW DDL [JOBS|QUERIES]ADMIN SHOW TELEMETRYALTER DATABASEALTER INDEXALTER INSTANCEALTER PLACEMENT POLICYALTER TABLEALTER TABLE COMPACTALTER USERANALYZE TABLEBACKUPBATCHBEGINCHANGE COLUMNCOMMITCHANGE DRAINERCHANGE PUMPCREATE [GLOBAL|SESSION] BINDINGCREATE DATABASECREATE INDEXCREATE PLACEMENT POLICYCREATE ROLECREATE SEQUENCECREATE TABLE LIKECREATE TABLECREATE USERCREATE VIEWDEALLOCATEDELETEDESCDESCRIBEDODROP [GLOBAL|SESSION] BINDINGDROP COLUMNDROP DATABASEDROP INDEXDROP PLACEMENT POLICYDROP ROLEDROP SEQUENCEDROP STATSDROP TABLEDROP USERDROP VIEWEXECUTEEXPLAIN ANALYZEEXPLAINFLASHBACK TABLEFLUSH PRIVILEGESFLUSH STATUSFLUSH TABLESGRANT <privileges>GRANT <role>INSERTKILL [TIDB]LOAD DATALOAD STATSMODIFY COLUMNPREPARERECOVER TABLERENAME INDEXRENAME TABLEREPLACERESTOREREVOKE <privileges>REVOKE <role>ROLLBACKSELECTSET DEFAULT ROLESET [NAMES|CHARACTER SET]SET PASSWORDSET ROLESET TRANSACTIONSET [GLOBAL|SESSION] <variable>SHOW ANALYZE STATUSSHOW [BACKUPS|RESTORES]SHOW [GLOBAL|SESSION] BINDINGSSHOW BUILTINSSHOW CHARACTER SETSHOW COLLATIONSHOW [FULL] COLUMNS FROMSHOW CONFIGSHOW CREATE PLACEMENT POLICYSHOW CREATE SEQUENCESHOW CREATE TABLESHOW CREATE USERSHOW DATABASESSHOW DRAINER STATUSSHOW ENGINESSHOW ERRORSSHOW [FULL] FIELDS FROMSHOW GRANTSSHOW INDEX [FROM|IN]SHOW INDEXES [FROM|IN]SHOW KEYS [FROM|IN]SHOW MASTER STATUSSHOW PLACEMENTSHOW PLACEMENT FORSHOW PLACEMENT LABELSSHOW PLUGINSSHOW PRIVILEGESSHOW [FULL] PROCESSSLISTSHOW PROFILESSHOW PUMP STATUSSHOW SCHEMASSHOW STATS_HEALTHYSHOW STATS_HISTOGRAMSSHOW STATS_METASHOW STATUSSHOW TABLE NEXT_ROW_IDSHOW TABLE REGIONSSHOW TABLE STATUSSHOW [FULL] TABLESSHOW [GLOBAL|SESSION] VARIABLESSHOW WARNINGSSHUTDOWNSPLIT REGIONSTART TRANSACTIONTABLETRACETRUNCATEUPDATEUSEWITH
- Data Types
- Functions and Operators
- Overview
- Type Conversion in Expression Evaluation
- Operators
- Control Flow Functions
- String Functions
- Numeric Functions and Operators
- Date and Time Functions
- Bit Functions and Operators
- Cast Functions and Operators
- Encryption and Compression Functions
- Locking Functions
- Information Functions
- JSON Functions
- Aggregate (GROUP BY) Functions
- Window Functions
- Miscellaneous Functions
- Precision Math
- Set Operations
- List of Expressions for Pushdown
- TiDB Specific Functions
- Clustered Indexes
- Constraints
- Generated Columns
- SQL Mode
- Table Attributes
- Transactions
- Garbage Collection (GC)
- Views
- Partitioning
- Temporary Tables
- Cached Tables
- Character Set and Collation
- Placement Rules in SQL
- System Tables
mysql- INFORMATION_SCHEMA
- Overview
ANALYZE_STATUSCLIENT_ERRORS_SUMMARY_BY_HOSTCLIENT_ERRORS_SUMMARY_BY_USERCLIENT_ERRORS_SUMMARY_GLOBALCHARACTER_SETSCLUSTER_CONFIGCLUSTER_HARDWARECLUSTER_INFOCLUSTER_LOADCLUSTER_LOGCLUSTER_SYSTEMINFOCOLLATIONSCOLLATION_CHARACTER_SET_APPLICABILITYCOLUMNSDATA_LOCK_WAITSDDL_JOBSDEADLOCKSENGINESINSPECTION_RESULTINSPECTION_RULESINSPECTION_SUMMARYKEY_COLUMN_USAGEMETRICS_SUMMARYMETRICS_TABLESPARTITIONSPLACEMENT_POLICIESPROCESSLISTREFERENTIAL_CONSTRAINTSSCHEMATASEQUENCESSESSION_VARIABLESSLOW_QUERYSTATISTICSTABLESTABLE_CONSTRAINTSTABLE_STORAGE_STATSTIDB_HOT_REGIONSTIDB_HOT_REGIONS_HISTORYTIDB_INDEXESTIDB_SERVERS_INFOTIDB_TRXTIFLASH_REPLICATIKV_REGION_PEERSTIKV_REGION_STATUSTIKV_STORE_STATUSUSER_PRIVILEGESVIEWS
METRICS_SCHEMA
- UI
- TiDB Dashboard
- Overview
- Maintain
- Access
- Overview Page
- Cluster Info Page
- Top SQL Page
- Key Visualizer Page
- Metrics Relation Graph
- SQL Statements Analysis
- Slow Queries Page
- Cluster Diagnostics
- Search Logs Page
- Instance Profiling
- Session Management and Configuration
- FAQ
- CLI
- Command Line Flags
- Configuration File Parameters
- System Variables
- Storage Engines
- Telemetry
- Errors Codes
- Table Filter
- Schedule Replicas by Topology Labels
- FAQs
- Release Notes
- All Releases
- Release Timeline
- TiDB Versioning
- v6.1
- v6.0
- v5.4
- v5.3
- v5.2
- v5.1
- v5.0
- v4.0
- v3.1
- v3.0
- v2.1
- v2.0
- v1.0
- Glossary
TiDB Dashboard Top SQL Page
With Top SQL, you can monitor and visually explore the CPU overhead of each SQL statement in your database in real-time, which helps you optimize and resolve database performance issues. Top SQL continuously collects and stores CPU load data summarized by SQL statements at any seconds from all TiDB and TiKV instances. The collected data can be stored for up to 30 days. Top SQL presents you with visual charts and tables to quickly pinpoint which SQL statements are contributing the high CPU load of a TiDB or TiKV instance over a certain period of time.
Top SQL provides the following features:
- Visualize the top 5 types of SQL statements with the highest CPU overhead through charts and tables.
- Display detailed execution information such as queries per second, average latency, and query plan.
- Collect all SQL statements that are executed, including those that are still running.
- Allow viewing data of a specific TiDB and TiKV instance.
Recommended scenarios
Top SQL is suitable for analyzing performance issues. The following are some typical Top SQL scenarios:
- You discovered that an individual TiKV instance in the cluster has a very high CPU usage through the Grafana charts. You want to know which SQL statements cause the CPU hotspots so that you can optimize them and better leverage all of your distributed resources.
- You discovered that the cluster has a very high CPU usage overall and queries are slow. You want to quickly figure out which SQL statements are currently consuming the most CPU resources so that you can optimize them.
- The CPU usage of the cluster has drastically changed and you want to know the major cause.
- Analyze the most resource-intensive SQL statements in the cluster and optimize them to reduce hardware costs.
Top SQL cannot be used to pinpoint non-performance issues, such as incorrect data or abnormal crashes.
The Top SQL feature is still in an early stage and is being continuously enhanced. Here are some scenarios that are not supported at the moment:
- Analyzing the overhead of SQL statements outside of Top 5 (for example, when multiple business workloads are mixed).
- Analyzing the overhead of Top N SQL statements by various dimensions such as users and databases.
- Analyzing database performance issues that are not caused by high CPU load, such as transaction lock conflicts.
Access the page
You can access the Top SQL page using either of the following methods:
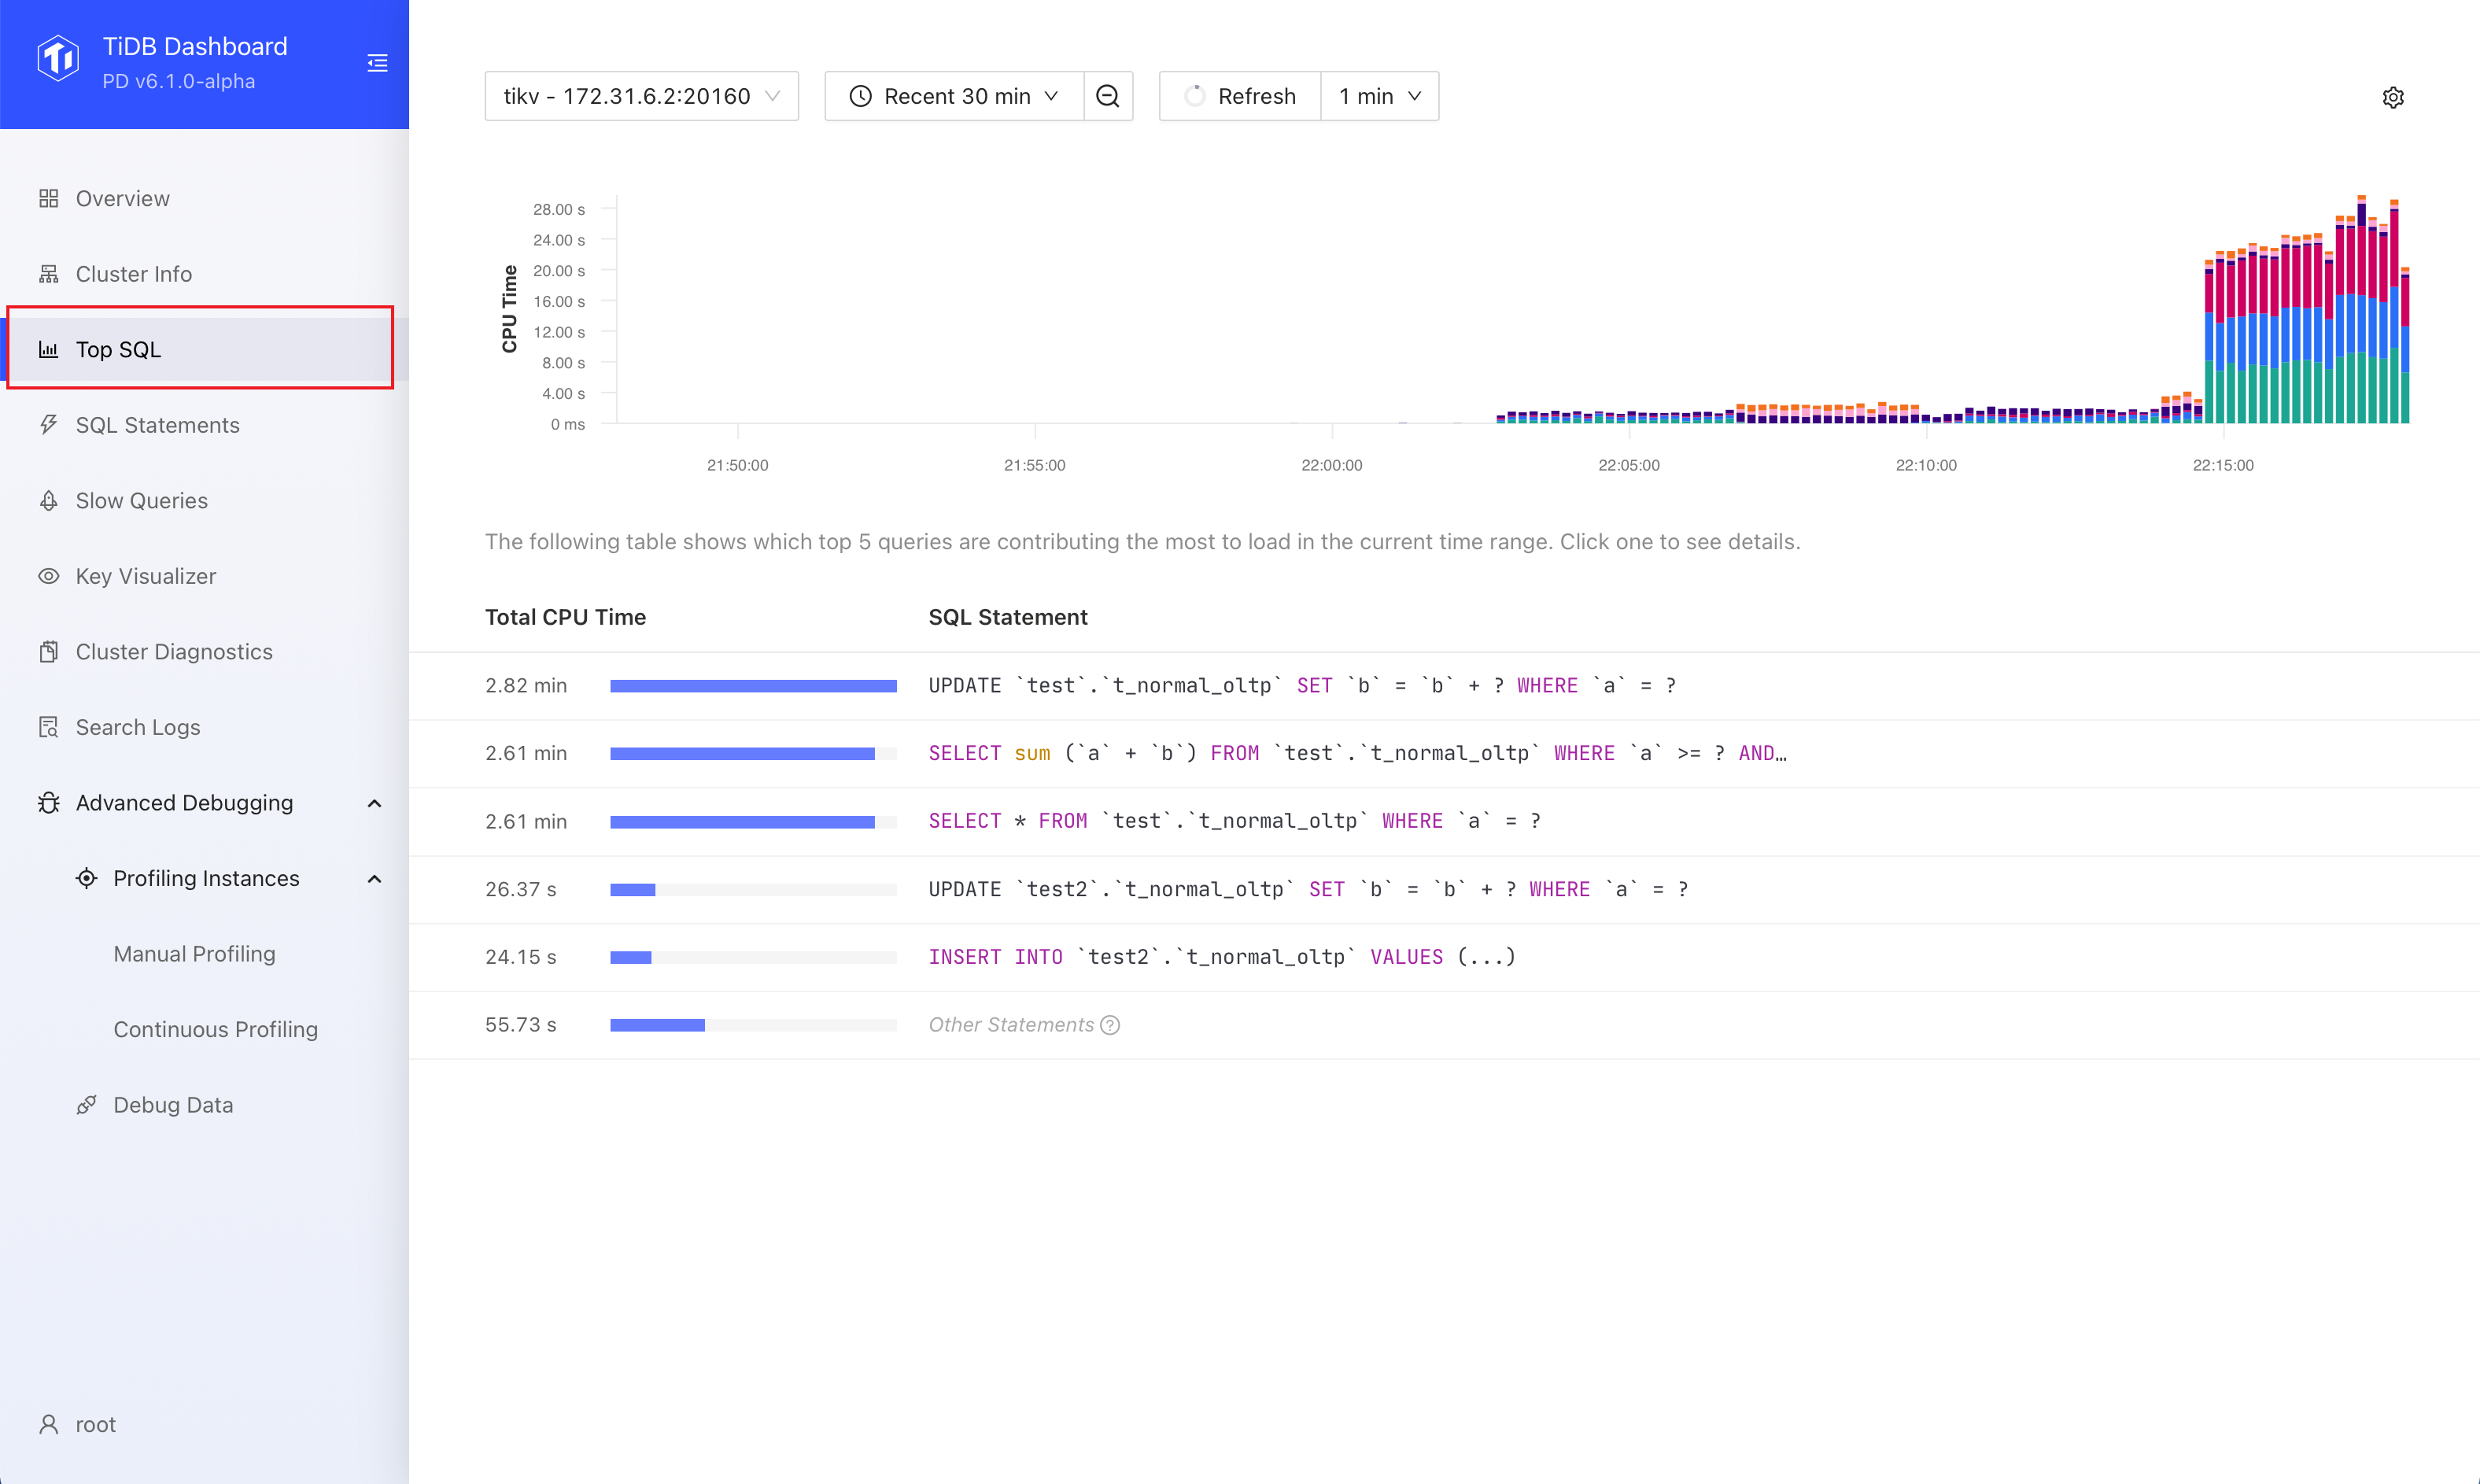
After logging into TiDB Dashboard, click Top SQL on the left navigation bar.
Visit http://127.0.0.1:2379/dashboard/#/topsql in your browser. Replace
127.0.0.1:2379with the actual PD instance address and port.
Enable Top SQL
To use Top SQL, your cluster should be deployed or upgraded with a recent version of TiUP (v1.9.0 or above) or TiDB Operator (v1.3.0 or above). If your cluster was upgraded using an earlier version of TiUP or TiDB Operator, see FAQ for instructions.
Top SQL is not enabled by default as it has a slight impact on cluster performance (within 3% on average) when enabled. You can enable Top SQL by the following steps:
- Visit the Top SQL page.
- Click Open Settings. On the right side of the Settings area, switch on Enable Feature.
- Click Save.
After enabling the feature, wait up to 1 minute for Top SQL to load the data. Then you can see the CPU load details.
In addition to the UI, you can also enable the Top SQL feature by setting the TiDB system variable tidb_enable_top_sql:
SET GLOBAL tidb_enable_top_sql = 1;
Use Top SQL
The following are the common steps to use Top SQL.
Visit the Top SQL page.
Select a particular TiDB or TiKV instance that you want to observe the load.
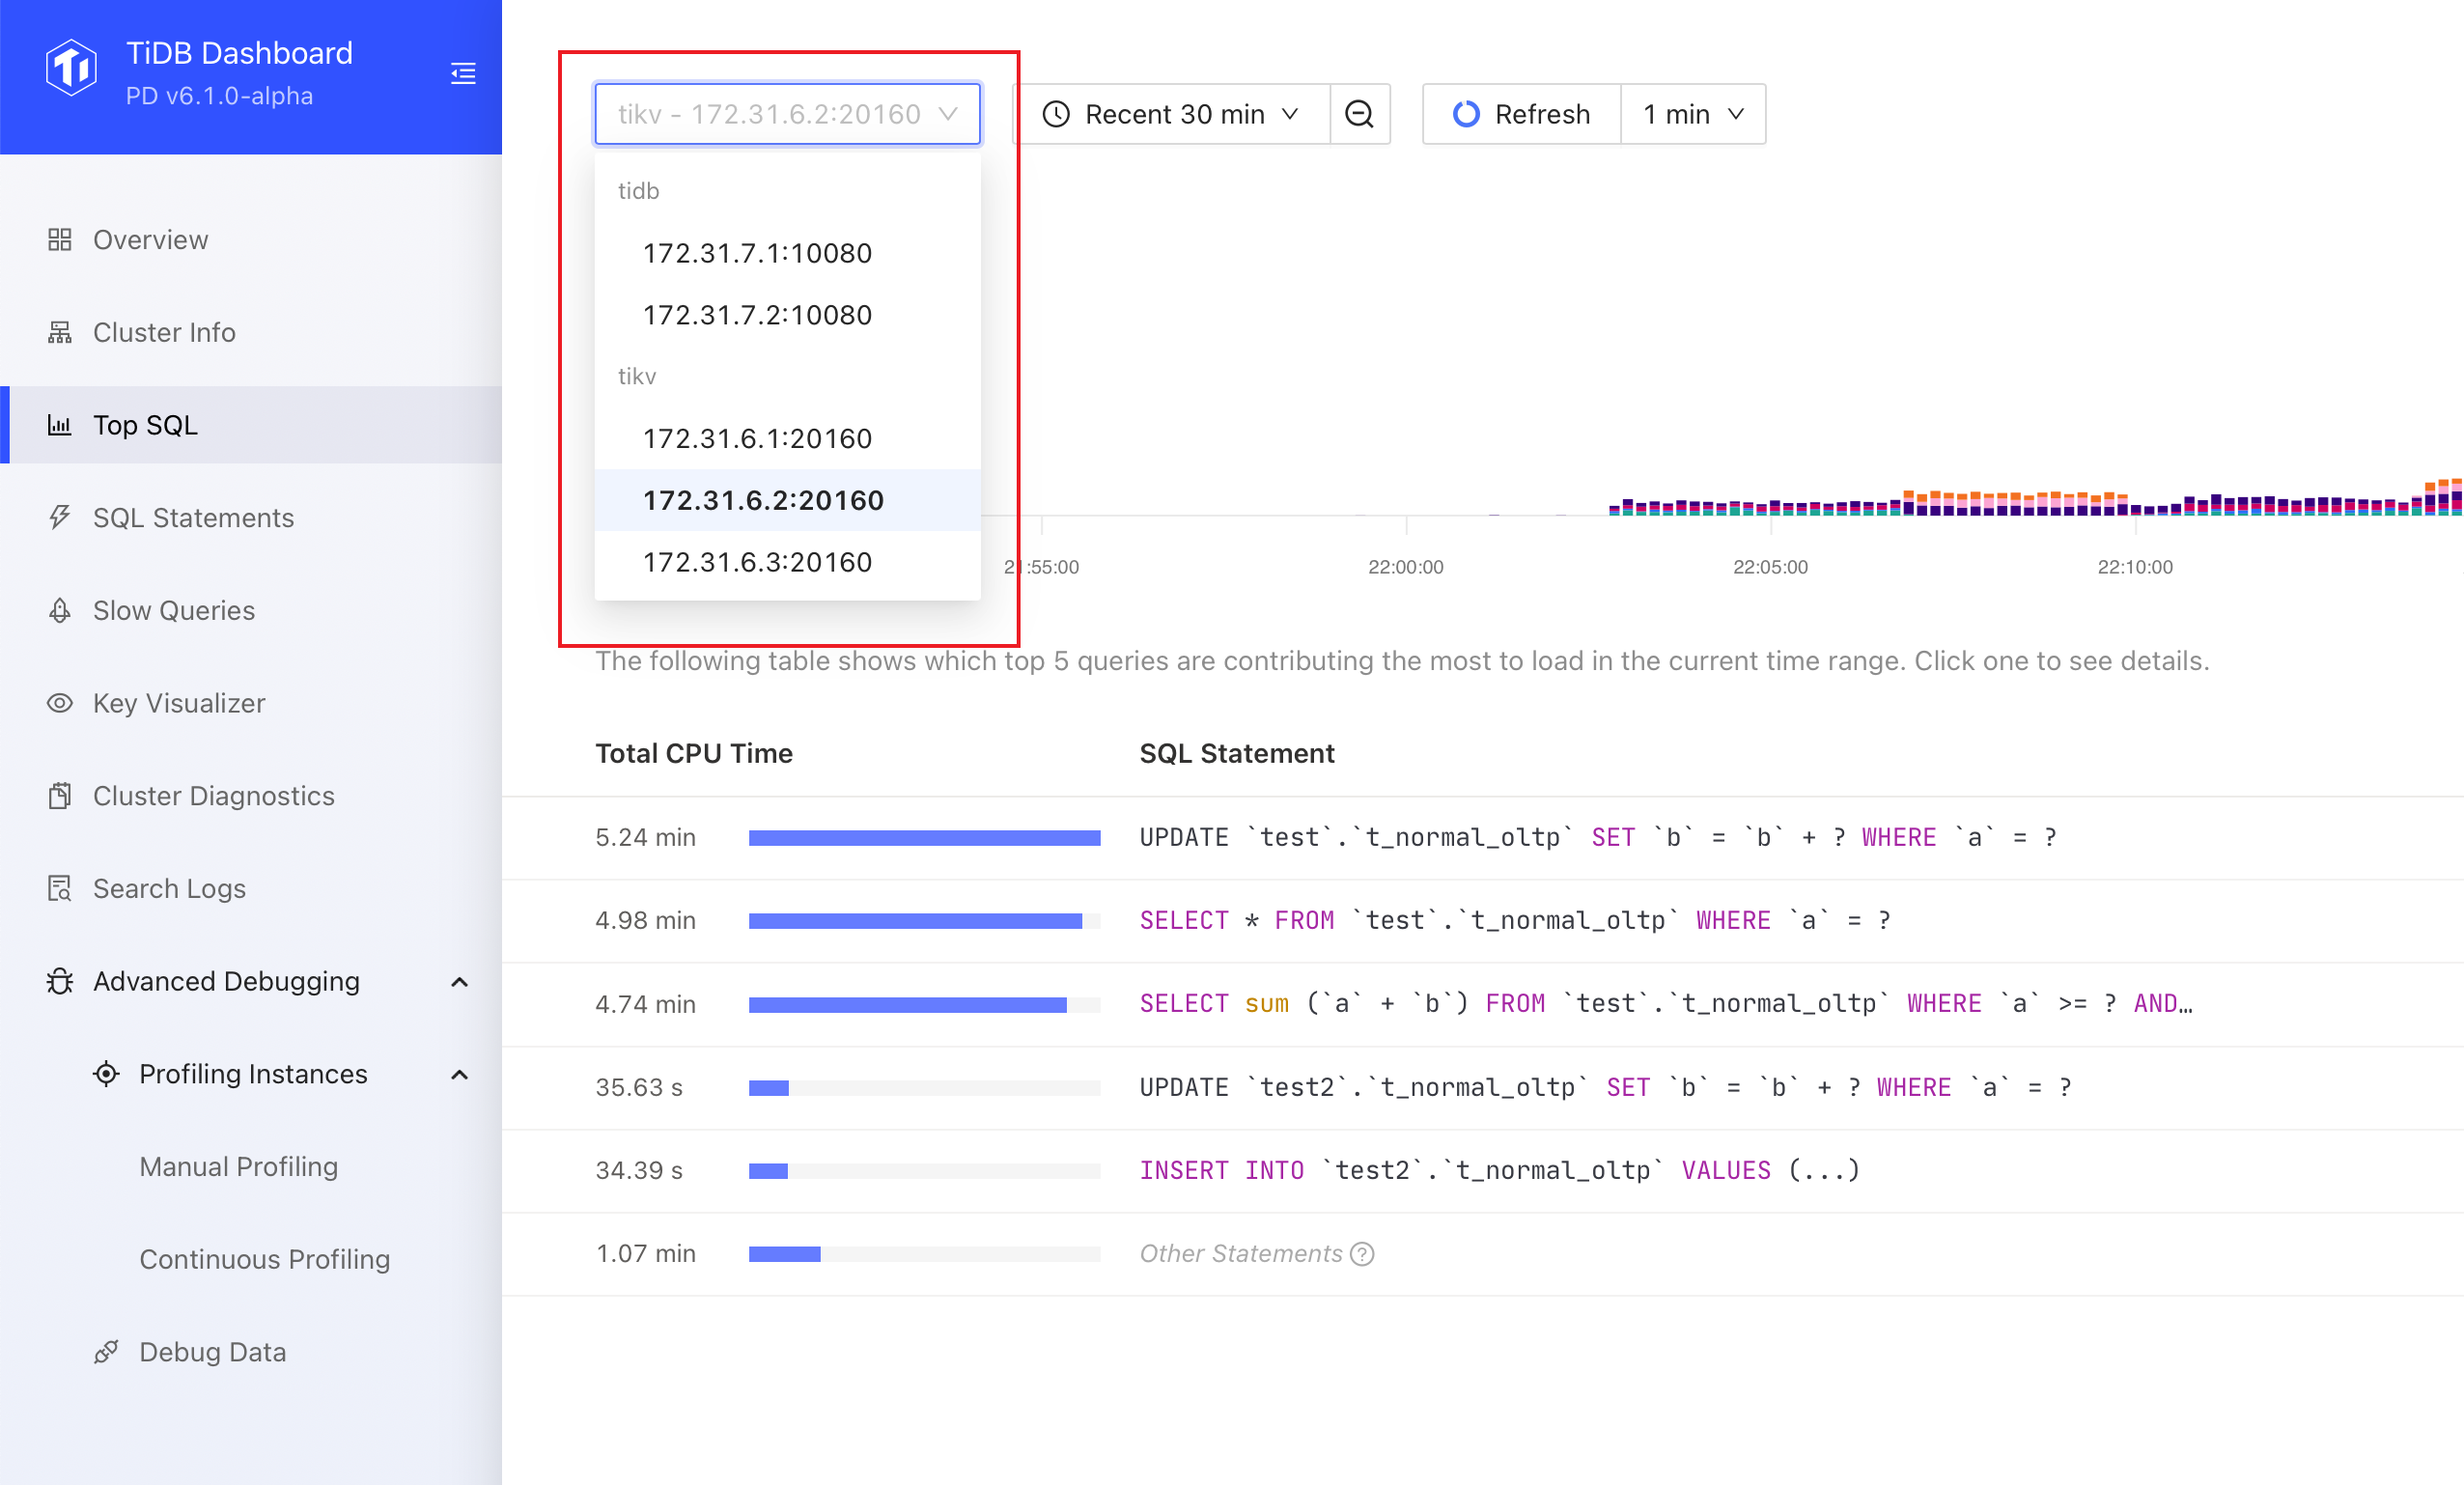
If you are unsure of which TiDB or TiKV instance to observe, you can select an arbitrary instance. Also, when the cluster CPU load is extremely unbalanced, you can first use Grafana charts to determine the specific instance you want to observe.
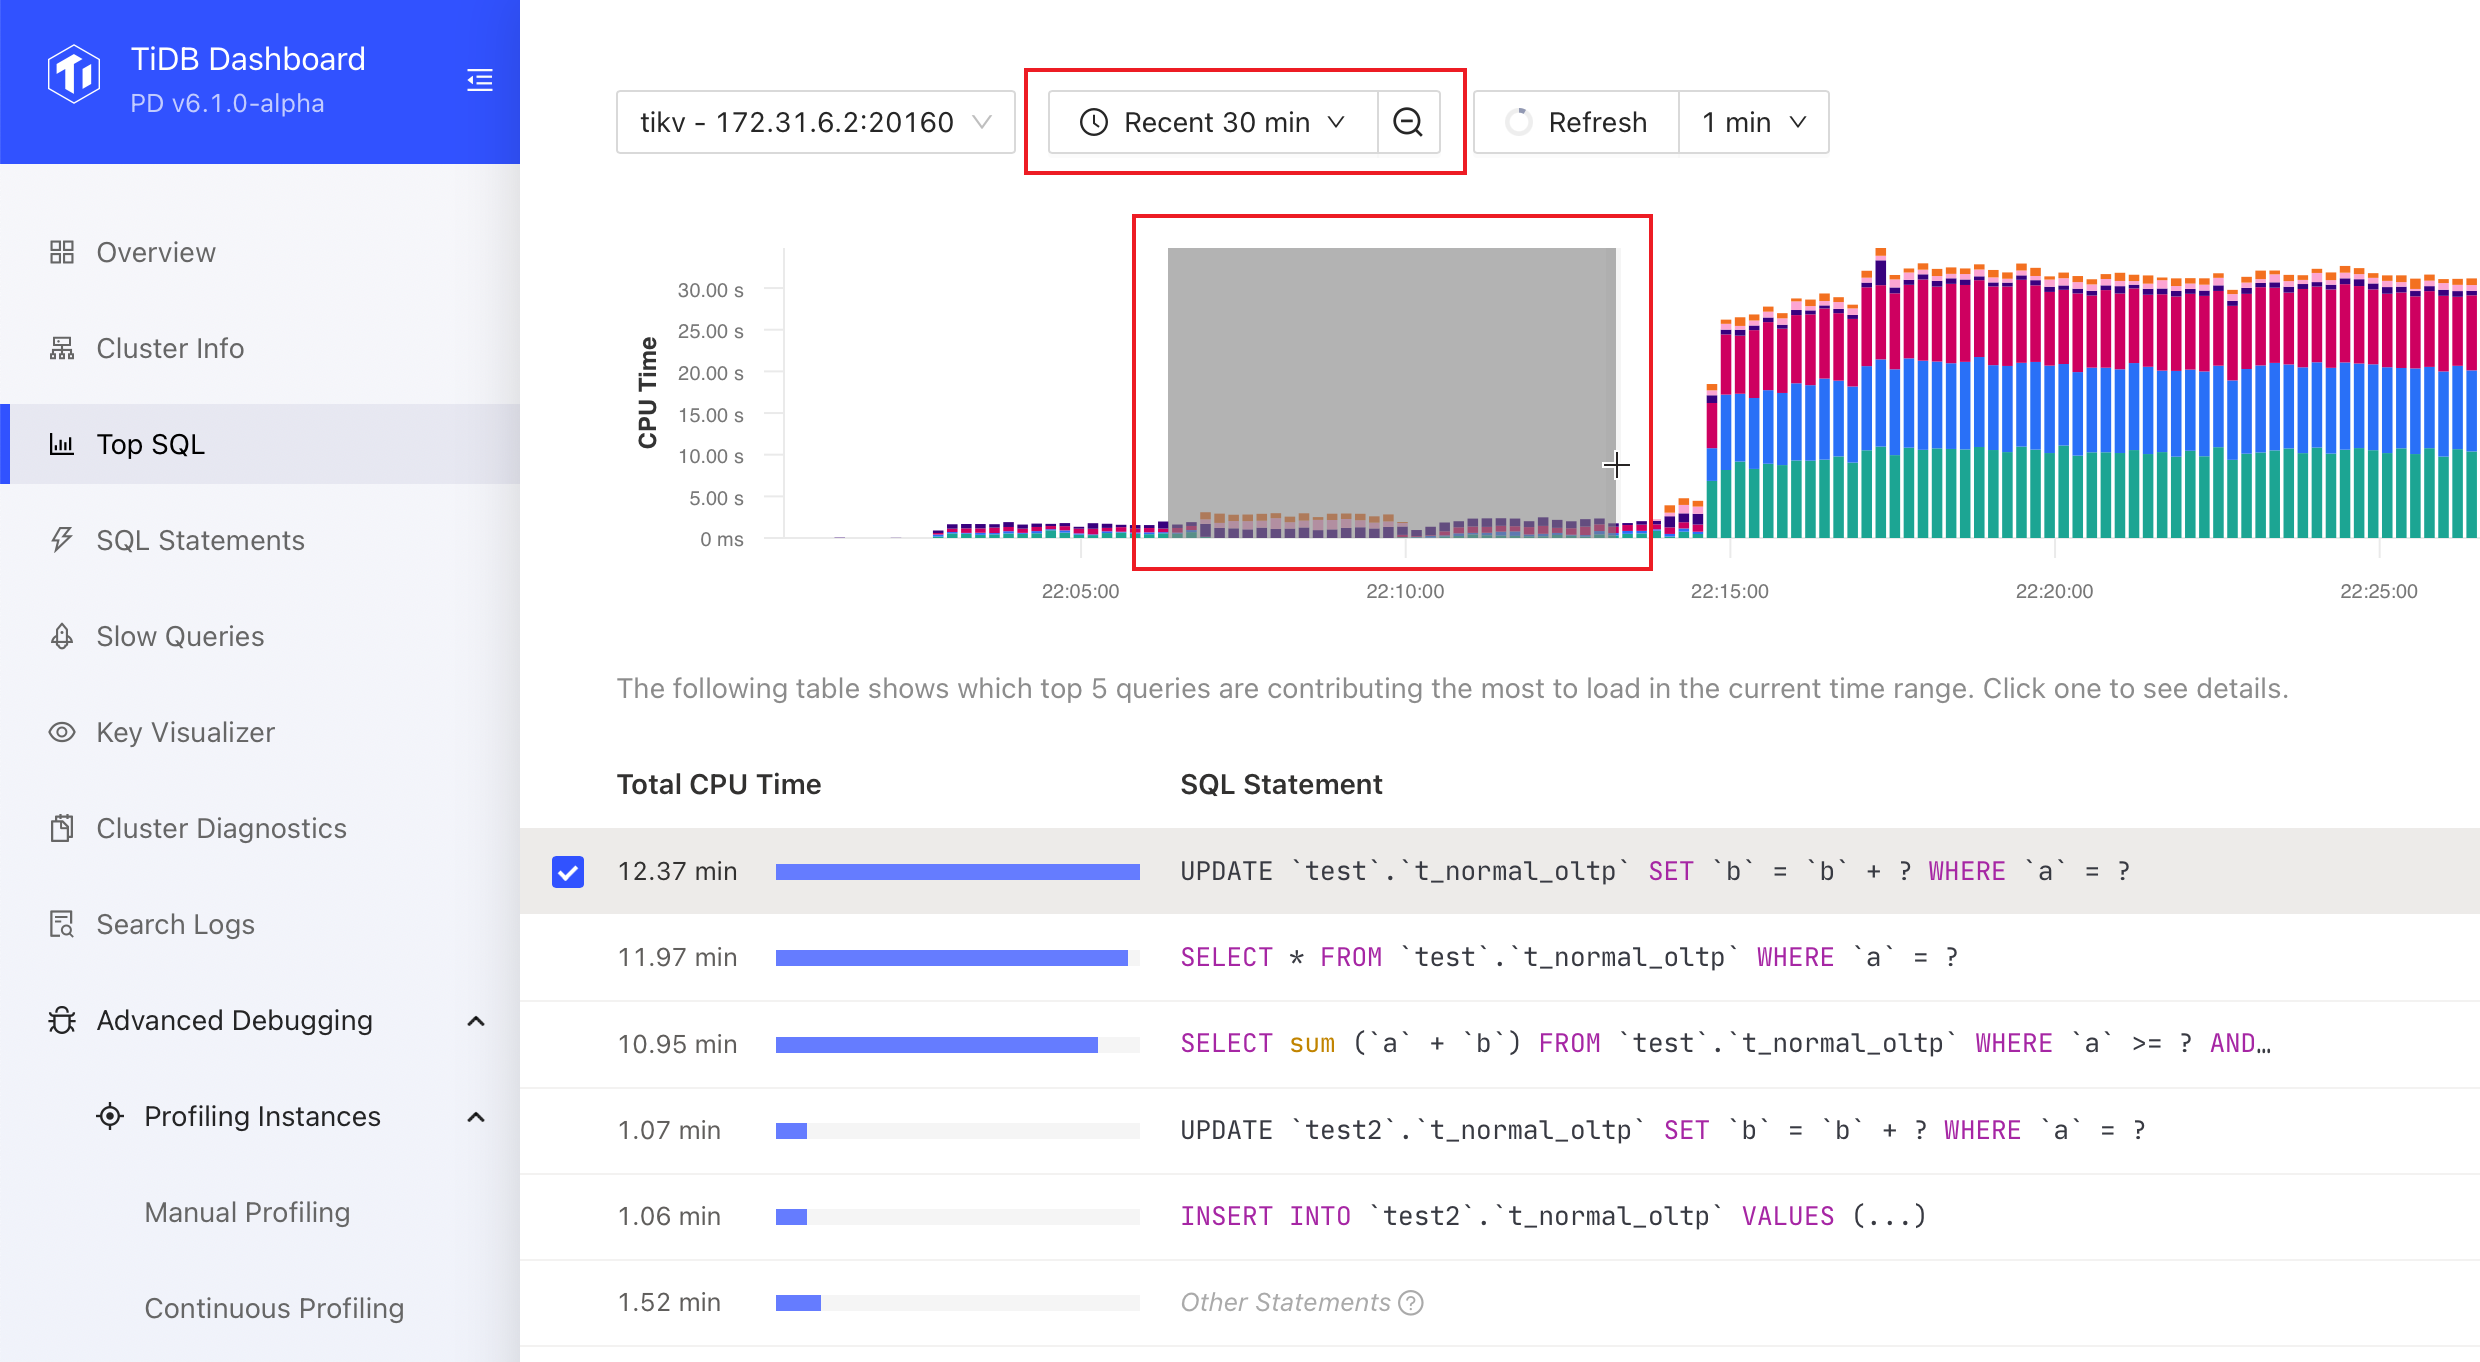
Observe the charts and tables presented by Top SQL.
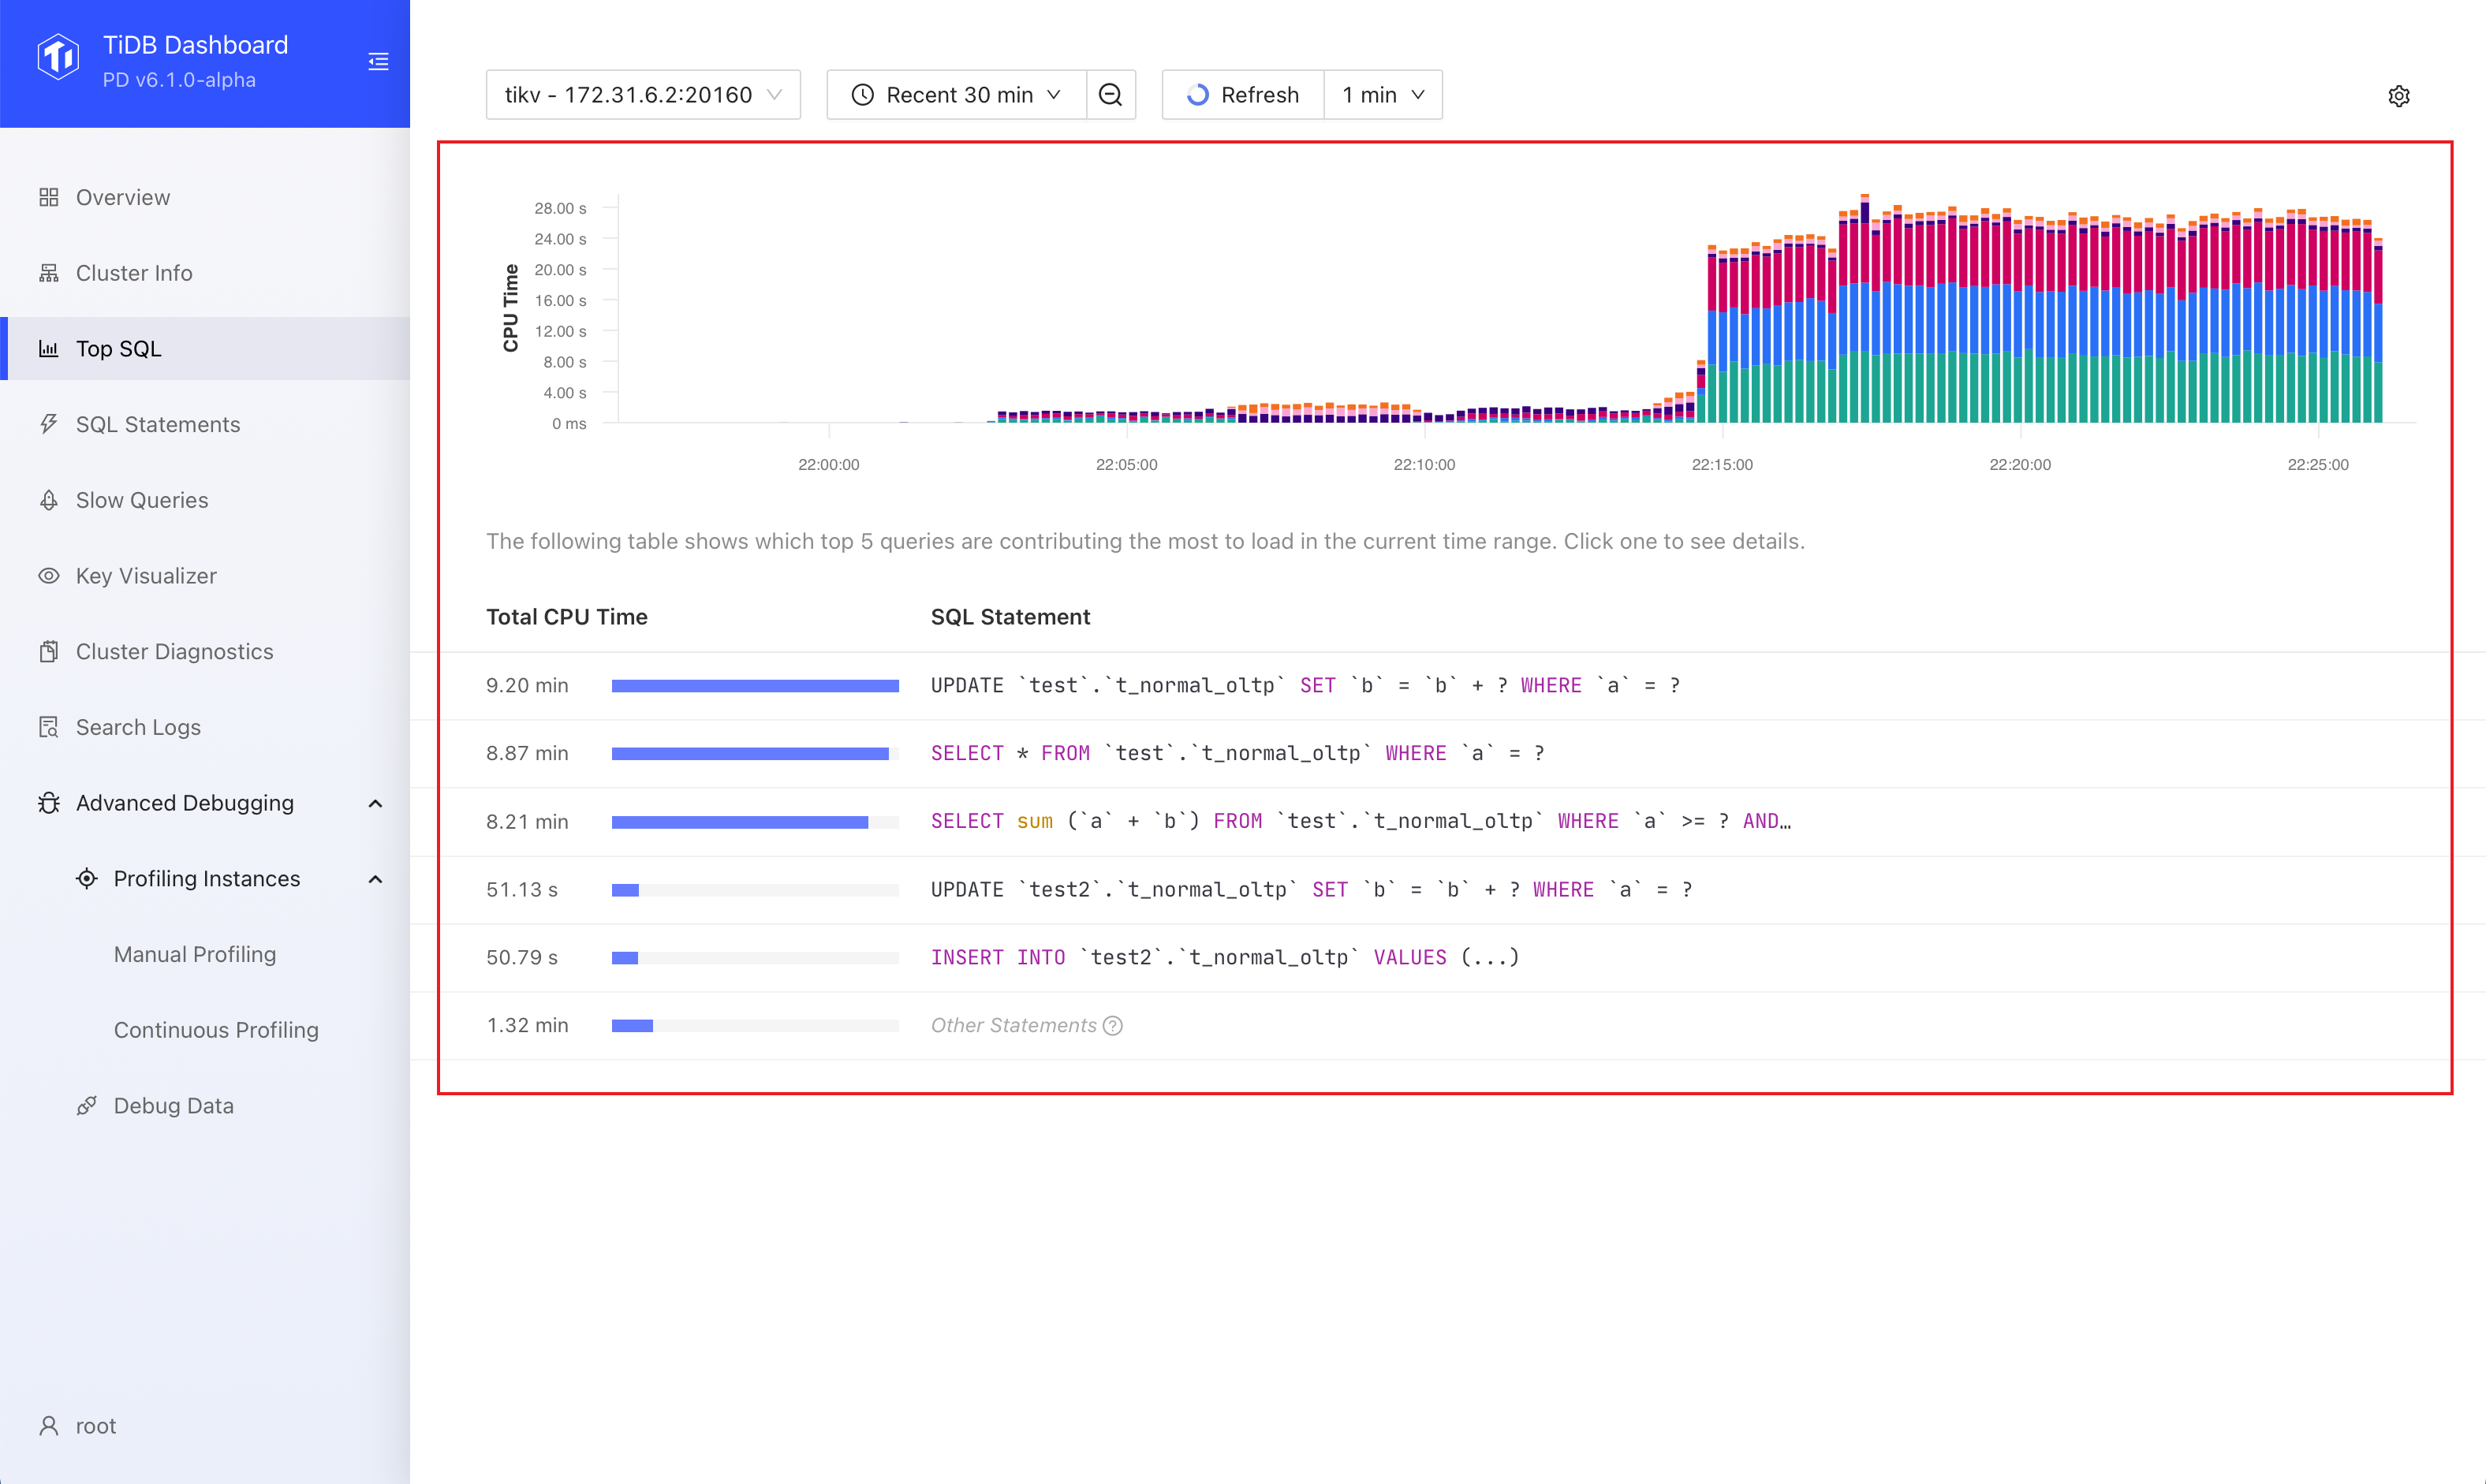
The size of the bars in the bar chart represents the size of CPU resources consumed by the SQL statement at that moment. Different colors distinguish different types of SQL statements. In most cases, you only need to focus on the SQL statements that have a higher CPU resource overhead in the corresponding time range in the chart.
Click a SQL statement in the table to show more information. You can see detailed execution metrics of different plans of that statement, such as Call/sec (average queries per second) and Scan Indexes/sec (average number of index rows scanned per second).
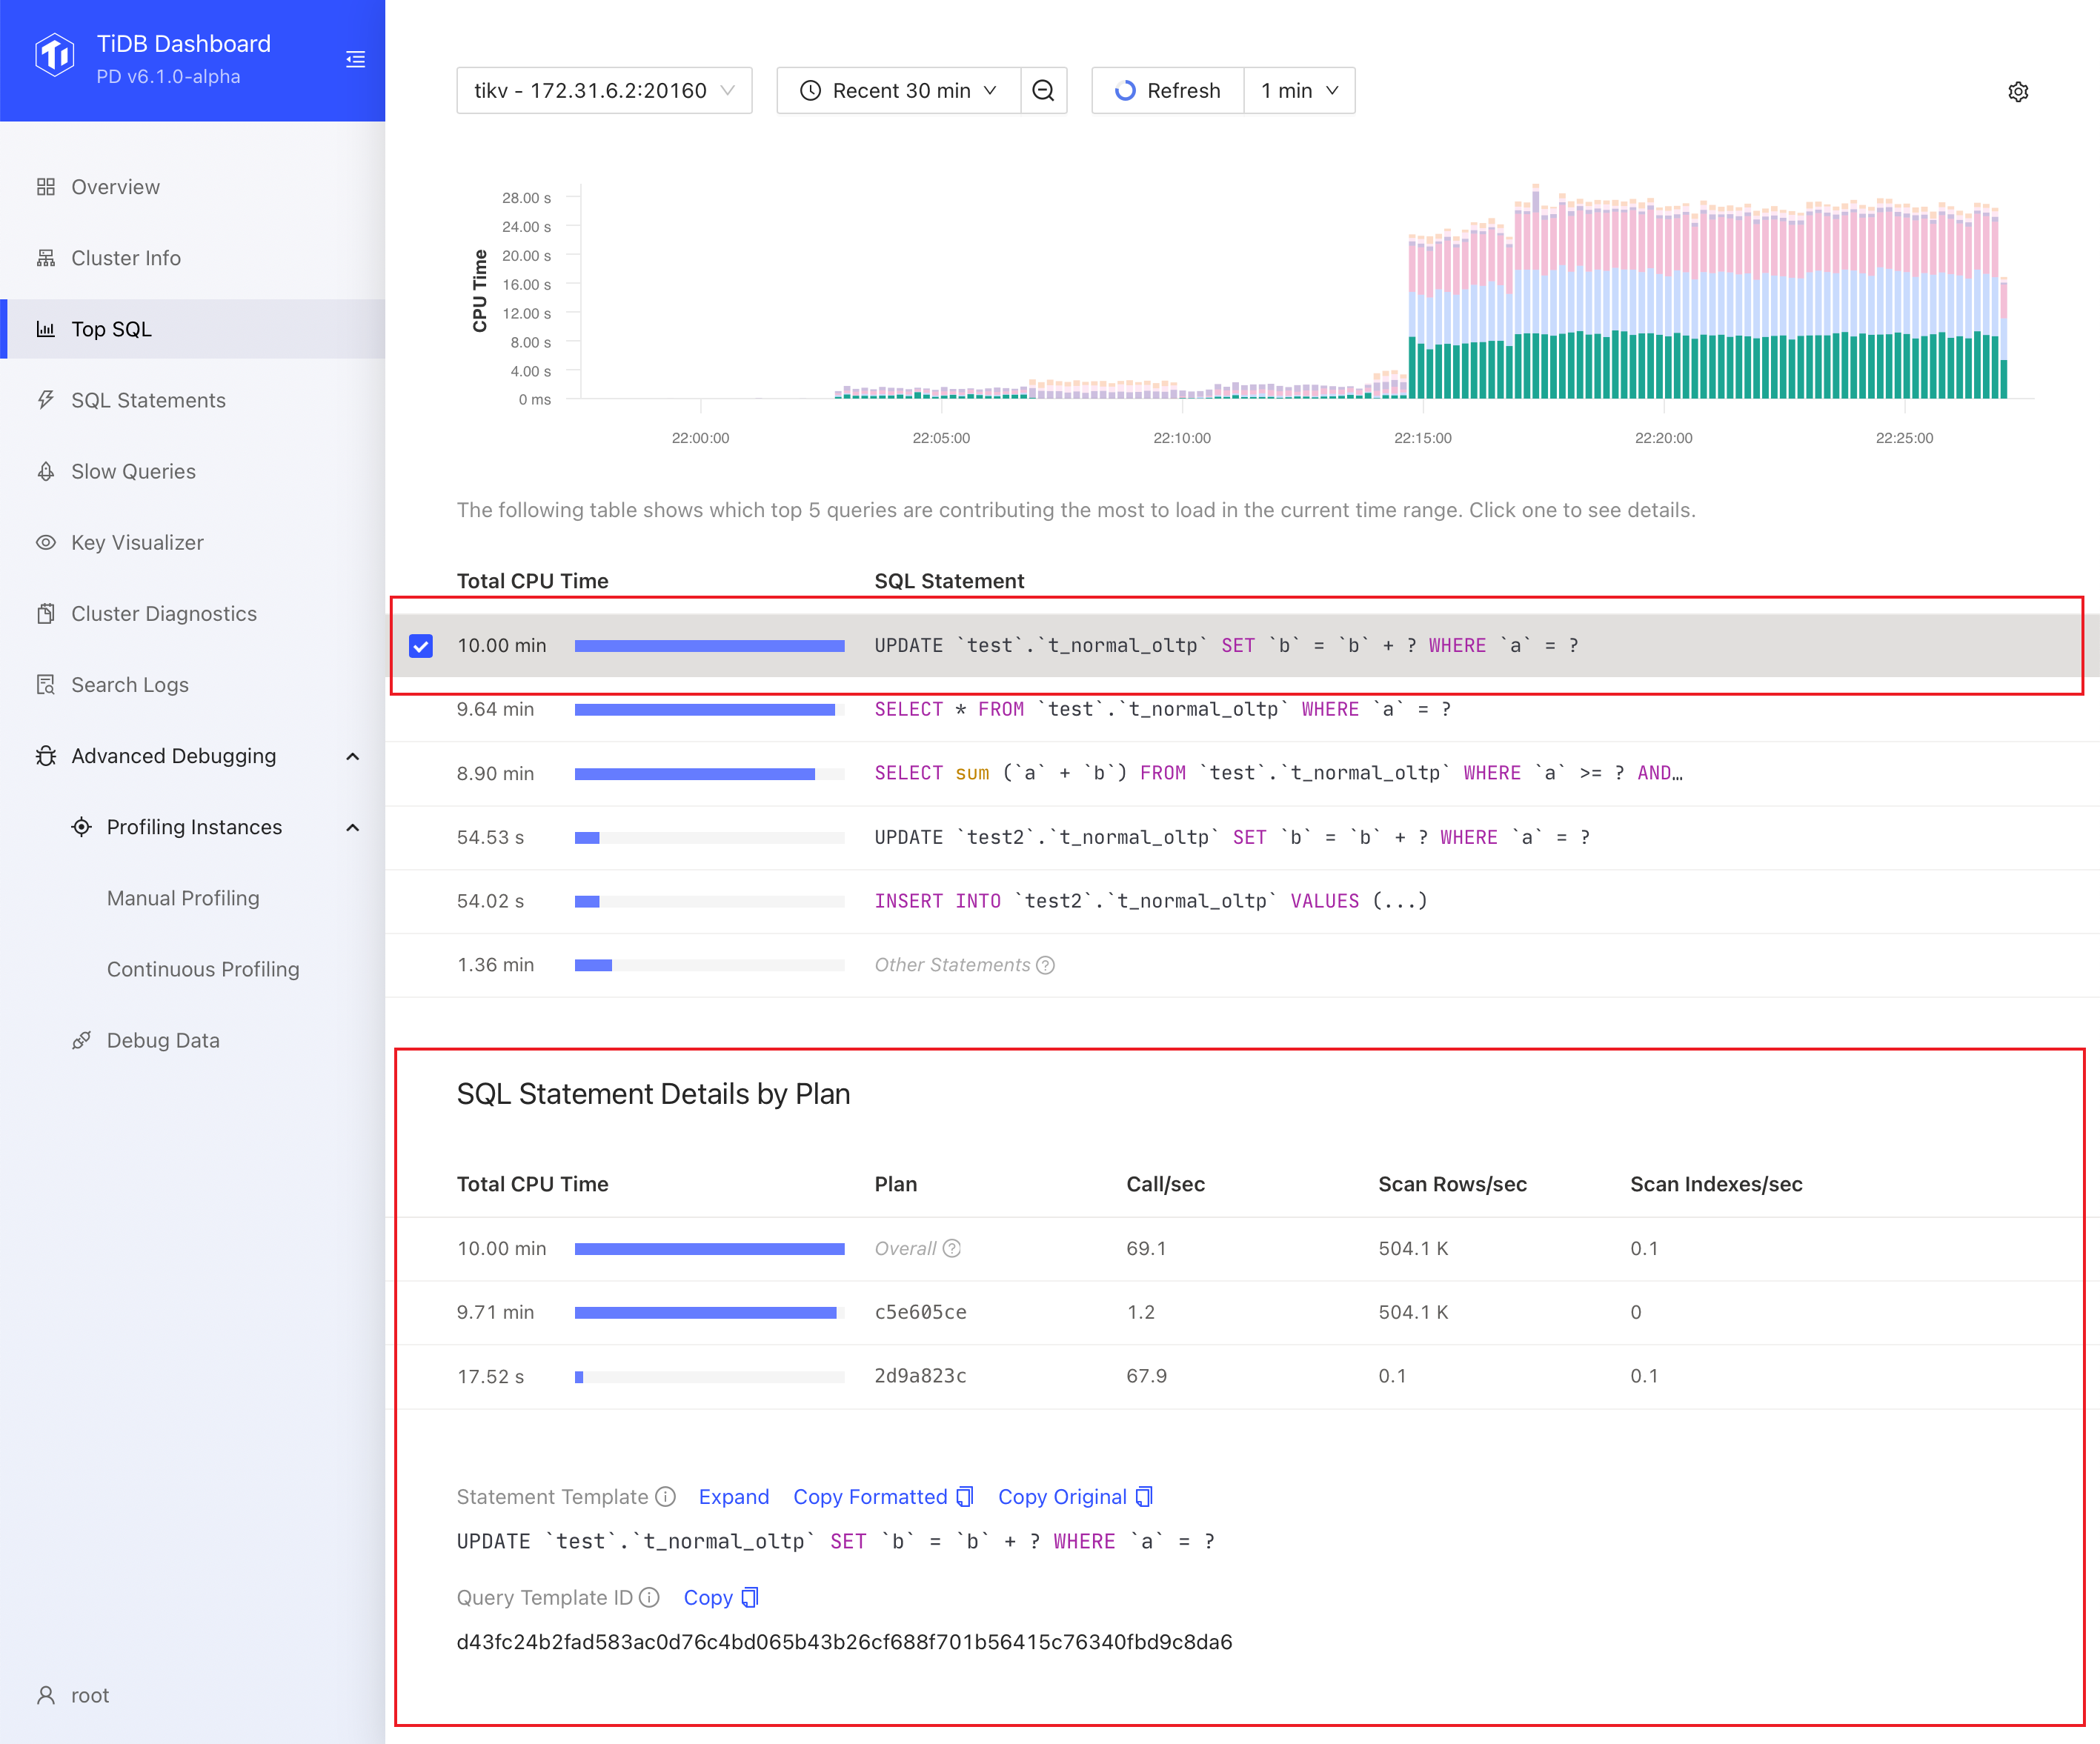
Based on these initial clues, you can further explore the SQL Statement or Slow Queries page to find the root cause of high CPU consumption or large data scans of the SQL statement.
Additionally, you can configure Top SQL as follows:
You can adjust the time range in the time picker or select a time range in the chart to get a more precise and detailed look at the problem. A smaller time range can provide more detailed data, with precision of up to 1 second.
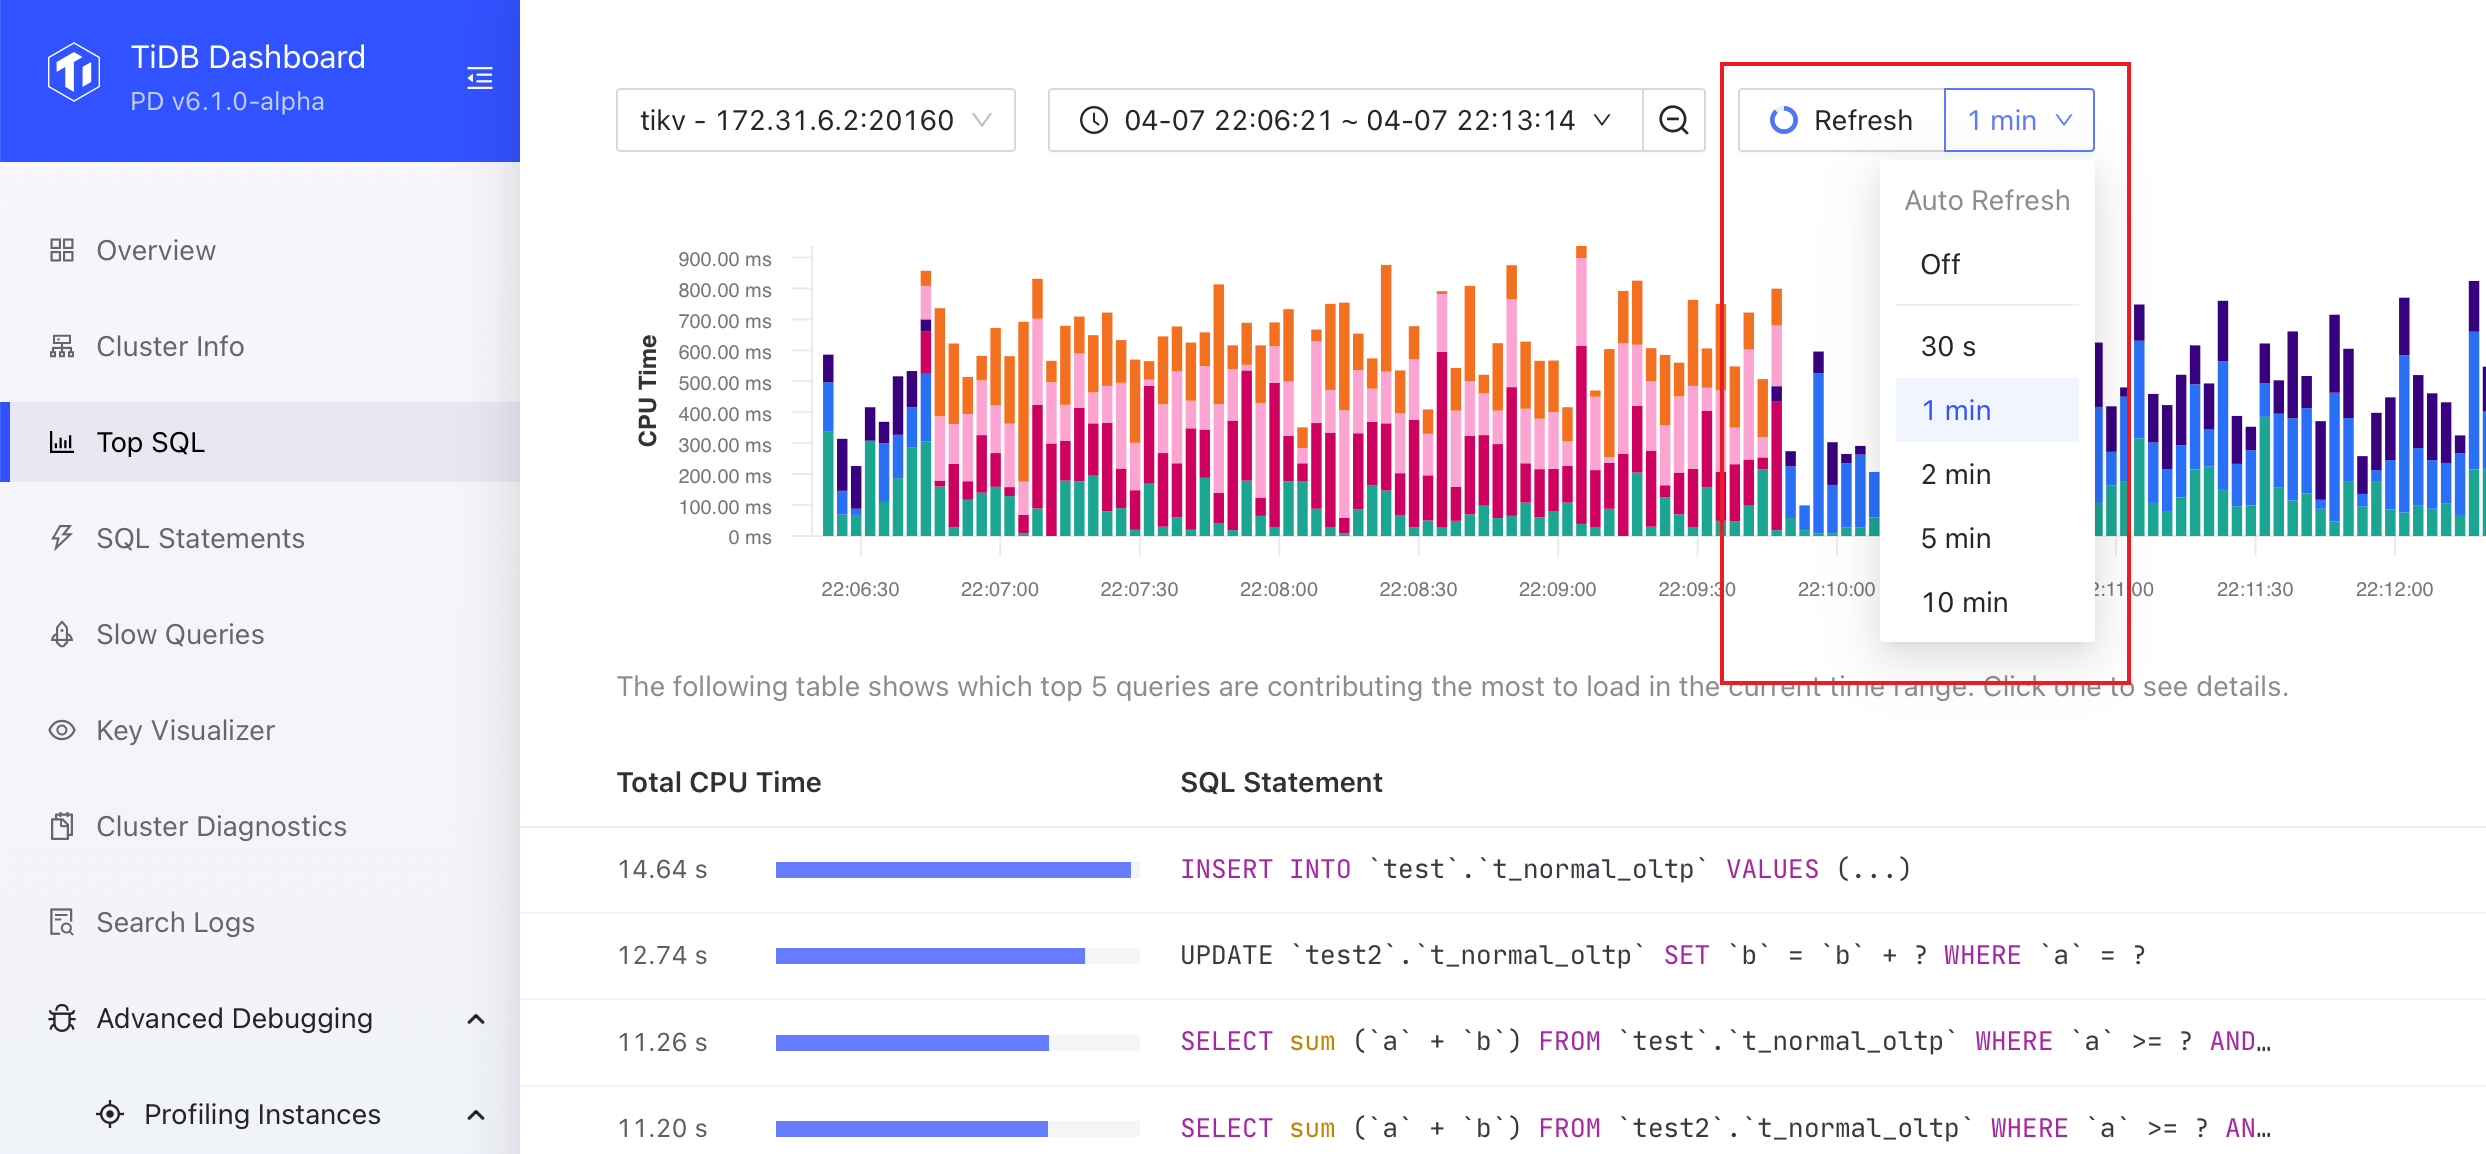
If the chart is out of date, you can click the Refresh button or select Auto Refresh options from the Refresh drop-down list.
Disable Top SQL
You can disable this feature by following these steps:
- Visit Top SQL page.
- Click the gear icon in the upper right corner to open the settings screen and switch off Enable Feature.
- Click Save.
- In the popped-up dialog box, click Disable.
In addition to the UI, you can also disable the Top SQL feature by setting the TiDB system variable tidb_enable_top_sql:
SET GLOBAL tidb_enable_top_sql = 0;
Frequently asked questions
1. Top SQL cannot be enabled and the UI displays "required component NgMonitoring is not started".
See TiDB Dashboard FAQ.
2. Will performance be affected after enabling Top SQL?
This feature has a slight impact on cluster performance. According to our benchmark, the average performance impact is usually less than 3% when the feature is enabled.
3. What is the status of this feature?
It is now a generally available (GA) feature and can be used in production environments.
4. What is the meaning of "Other Statements"?
"Other Statement" counts the total CPU overhead of all non-Top 5 statements. With this information, you can learn the CPU overhead contributed by the Top 5 statements compared with the overall.
5. What is the relationship between the CPU overhead displayed by Top SQL and the actual CPU usage of the process?
Their correlation is strong but they are not exactly the same thing. For example, the cost of writing multiple replicas is not counted in the TiKV CPU overhead displayed by Top SQL. In general, SQL statements with higher CPU usage result in higher CPU overhead displayed in Top SQL.
6. What is the meaning of the Y-axis of the Top SQL chart?
It represents the size of CPU resources consumed. The more resources consumed by a SQL statement, the higher the value is. In most cases, you do not need to care about the meaning or unit of the specific value.
7. Does Top SQL collect running (unfinished) SQL statements?
Yes. The bars displayed in the Top SQL chart at each moment indicate the CPU overhead of all running SQL statements at that moment.