- Docs Home
- About TiDB
- Quick Start
- Develop
- Overview
- Quick Start
- Build a TiDB Cluster in TiDB Cloud (Developer Tier)
- CRUD SQL in TiDB
- Build a Simple CRUD App with TiDB
- Example Applications
- Connect to TiDB
- Design Database Schema
- Write Data
- Read Data
- Transaction
- Optimize
- Troubleshoot
- Reference
- Cloud Native Development Environment
- Third-party Support
- Deploy
- Software and Hardware Requirements
- Environment Configuration Checklist
- Plan Cluster Topology
- Install and Start
- Verify Cluster Status
- Test Cluster Performance
- Migrate
- Overview
- Migration Tools
- Migration Scenarios
- Migrate from Aurora
- Migrate MySQL of Small Datasets
- Migrate MySQL of Large Datasets
- Migrate and Merge MySQL Shards of Small Datasets
- Migrate and Merge MySQL Shards of Large Datasets
- Migrate from CSV Files
- Migrate from SQL Files
- Migrate from One TiDB Cluster to Another TiDB Cluster
- Migrate from TiDB to MySQL-compatible Databases
- Advanced Migration
- Integrate
- Maintain
- Monitor and Alert
- Troubleshoot
- TiDB Troubleshooting Map
- Identify Slow Queries
- Analyze Slow Queries
- SQL Diagnostics
- Identify Expensive Queries Using Top SQL
- Identify Expensive Queries Using Logs
- Statement Summary Tables
- Troubleshoot Hotspot Issues
- Troubleshoot Increased Read and Write Latency
- Save and Restore the On-Site Information of a Cluster
- Troubleshoot Cluster Setup
- Troubleshoot High Disk I/O Usage
- Troubleshoot Lock Conflicts
- Troubleshoot TiFlash
- Troubleshoot Write Conflicts in Optimistic Transactions
- Troubleshoot Inconsistency Between Data and Indexes
- Performance Tuning
- Tuning Guide
- Configuration Tuning
- System Tuning
- Software Tuning
- SQL Tuning
- Overview
- Understanding the Query Execution Plan
- SQL Optimization Process
- Overview
- Logic Optimization
- Physical Optimization
- Prepare Execution Plan Cache
- Control Execution Plans
- Tutorials
- TiDB Tools
- Overview
- Use Cases
- Download
- TiUP
- Documentation Map
- Overview
- Terminology and Concepts
- Manage TiUP Components
- FAQ
- Troubleshooting Guide
- Command Reference
- Overview
- TiUP Commands
- TiUP Cluster Commands
- Overview
- tiup cluster audit
- tiup cluster check
- tiup cluster clean
- tiup cluster deploy
- tiup cluster destroy
- tiup cluster disable
- tiup cluster display
- tiup cluster edit-config
- tiup cluster enable
- tiup cluster help
- tiup cluster import
- tiup cluster list
- tiup cluster patch
- tiup cluster prune
- tiup cluster reload
- tiup cluster rename
- tiup cluster replay
- tiup cluster restart
- tiup cluster scale-in
- tiup cluster scale-out
- tiup cluster start
- tiup cluster stop
- tiup cluster template
- tiup cluster upgrade
- TiUP DM Commands
- Overview
- tiup dm audit
- tiup dm deploy
- tiup dm destroy
- tiup dm disable
- tiup dm display
- tiup dm edit-config
- tiup dm enable
- tiup dm help
- tiup dm import
- tiup dm list
- tiup dm patch
- tiup dm prune
- tiup dm reload
- tiup dm replay
- tiup dm restart
- tiup dm scale-in
- tiup dm scale-out
- tiup dm start
- tiup dm stop
- tiup dm template
- tiup dm upgrade
- TiDB Cluster Topology Reference
- DM Cluster Topology Reference
- Mirror Reference Guide
- TiUP Components
- PingCAP Clinic Diagnostic Service
- TiDB Operator
- Dumpling
- TiDB Lightning
- TiDB Data Migration
- About TiDB Data Migration
- Architecture
- Quick Start
- Deploy a DM cluster
- Tutorials
- Advanced Tutorials
- Maintain
- Cluster Upgrade
- Tools
- Performance Tuning
- Manage Data Sources
- Manage Tasks
- Export and Import Data Sources and Task Configurations of Clusters
- Handle Alerts
- Daily Check
- Reference
- Architecture
- Command Line
- Configuration Files
- OpenAPI
- Compatibility Catalog
- Secure
- Monitoring and Alerts
- Error Codes
- Glossary
- Example
- Troubleshoot
- Release Notes
- Backup & Restore (BR)
- TiDB Binlog
- TiCDC
- Dumpling
- sync-diff-inspector
- TiSpark
- Reference
- Cluster Architecture
- Key Monitoring Metrics
- Secure
- Privileges
- SQL
- SQL Language Structure and Syntax
- SQL Statements
ADD COLUMNADD INDEXADMINADMIN CANCEL DDLADMIN CHECKSUM TABLEADMIN CHECK [TABLE|INDEX]ADMIN SHOW DDL [JOBS|QUERIES]ADMIN SHOW TELEMETRYALTER DATABASEALTER INDEXALTER INSTANCEALTER PLACEMENT POLICYALTER TABLEALTER TABLE COMPACTALTER USERANALYZE TABLEBACKUPBATCHBEGINCHANGE COLUMNCOMMITCHANGE DRAINERCHANGE PUMPCREATE [GLOBAL|SESSION] BINDINGCREATE DATABASECREATE INDEXCREATE PLACEMENT POLICYCREATE ROLECREATE SEQUENCECREATE TABLE LIKECREATE TABLECREATE USERCREATE VIEWDEALLOCATEDELETEDESCDESCRIBEDODROP [GLOBAL|SESSION] BINDINGDROP COLUMNDROP DATABASEDROP INDEXDROP PLACEMENT POLICYDROP ROLEDROP SEQUENCEDROP STATSDROP TABLEDROP USERDROP VIEWEXECUTEEXPLAIN ANALYZEEXPLAINFLASHBACK TABLEFLUSH PRIVILEGESFLUSH STATUSFLUSH TABLESGRANT <privileges>GRANT <role>INSERTKILL [TIDB]LOAD DATALOAD STATSMODIFY COLUMNPREPARERECOVER TABLERENAME INDEXRENAME TABLEREPLACERESTOREREVOKE <privileges>REVOKE <role>ROLLBACKSELECTSET DEFAULT ROLESET [NAMES|CHARACTER SET]SET PASSWORDSET ROLESET TRANSACTIONSET [GLOBAL|SESSION] <variable>SHOW ANALYZE STATUSSHOW [BACKUPS|RESTORES]SHOW [GLOBAL|SESSION] BINDINGSSHOW BUILTINSSHOW CHARACTER SETSHOW COLLATIONSHOW [FULL] COLUMNS FROMSHOW CONFIGSHOW CREATE PLACEMENT POLICYSHOW CREATE SEQUENCESHOW CREATE TABLESHOW CREATE USERSHOW DATABASESSHOW DRAINER STATUSSHOW ENGINESSHOW ERRORSSHOW [FULL] FIELDS FROMSHOW GRANTSSHOW INDEX [FROM|IN]SHOW INDEXES [FROM|IN]SHOW KEYS [FROM|IN]SHOW MASTER STATUSSHOW PLACEMENTSHOW PLACEMENT FORSHOW PLACEMENT LABELSSHOW PLUGINSSHOW PRIVILEGESSHOW [FULL] PROCESSSLISTSHOW PROFILESSHOW PUMP STATUSSHOW SCHEMASSHOW STATS_HEALTHYSHOW STATS_HISTOGRAMSSHOW STATS_METASHOW STATUSSHOW TABLE NEXT_ROW_IDSHOW TABLE REGIONSSHOW TABLE STATUSSHOW [FULL] TABLESSHOW [GLOBAL|SESSION] VARIABLESSHOW WARNINGSSHUTDOWNSPLIT REGIONSTART TRANSACTIONTABLETRACETRUNCATEUPDATEUSEWITH
- Data Types
- Functions and Operators
- Overview
- Type Conversion in Expression Evaluation
- Operators
- Control Flow Functions
- String Functions
- Numeric Functions and Operators
- Date and Time Functions
- Bit Functions and Operators
- Cast Functions and Operators
- Encryption and Compression Functions
- Locking Functions
- Information Functions
- JSON Functions
- Aggregate (GROUP BY) Functions
- Window Functions
- Miscellaneous Functions
- Precision Math
- Set Operations
- List of Expressions for Pushdown
- TiDB Specific Functions
- Clustered Indexes
- Constraints
- Generated Columns
- SQL Mode
- Table Attributes
- Transactions
- Garbage Collection (GC)
- Views
- Partitioning
- Temporary Tables
- Cached Tables
- Character Set and Collation
- Placement Rules in SQL
- System Tables
mysql- INFORMATION_SCHEMA
- Overview
ANALYZE_STATUSCLIENT_ERRORS_SUMMARY_BY_HOSTCLIENT_ERRORS_SUMMARY_BY_USERCLIENT_ERRORS_SUMMARY_GLOBALCHARACTER_SETSCLUSTER_CONFIGCLUSTER_HARDWARECLUSTER_INFOCLUSTER_LOADCLUSTER_LOGCLUSTER_SYSTEMINFOCOLLATIONSCOLLATION_CHARACTER_SET_APPLICABILITYCOLUMNSDATA_LOCK_WAITSDDL_JOBSDEADLOCKSENGINESINSPECTION_RESULTINSPECTION_RULESINSPECTION_SUMMARYKEY_COLUMN_USAGEMETRICS_SUMMARYMETRICS_TABLESPARTITIONSPLACEMENT_POLICIESPROCESSLISTREFERENTIAL_CONSTRAINTSSCHEMATASEQUENCESSESSION_VARIABLESSLOW_QUERYSTATISTICSTABLESTABLE_CONSTRAINTSTABLE_STORAGE_STATSTIDB_HOT_REGIONSTIDB_HOT_REGIONS_HISTORYTIDB_INDEXESTIDB_SERVERS_INFOTIDB_TRXTIFLASH_REPLICATIKV_REGION_PEERSTIKV_REGION_STATUSTIKV_STORE_STATUSUSER_PRIVILEGESVIEWS
METRICS_SCHEMA
- UI
- TiDB Dashboard
- Overview
- Maintain
- Access
- Overview Page
- Cluster Info Page
- Top SQL Page
- Key Visualizer Page
- Metrics Relation Graph
- SQL Statements Analysis
- Slow Queries Page
- Cluster Diagnostics
- Search Logs Page
- Instance Profiling
- Session Management and Configuration
- FAQ
- CLI
- Command Line Flags
- Configuration File Parameters
- System Variables
- Storage Engines
- Telemetry
- Errors Codes
- Table Filter
- Schedule Replicas by Topology Labels
- FAQs
- Release Notes
- All Releases
- Release Timeline
- TiDB Versioning
- v6.1
- v6.0
- v5.4
- v5.3
- v5.2
- v5.1
- v5.0
- v4.0
- v3.1
- v3.0
- v2.1
- v2.0
- v1.0
- Glossary
Key Metrics on Performance Overview
If you use TiUP to deploy the TiDB cluster, the monitoring system (Prometheus & Grafana) is deployed at the same time. For more information, see TiDB Monitoring Framework Overview.
The Grafana dashboard is divided into a series of sub dashboards which include PD, TiDB, TiKV, Node_exporter, Overview, Performance Overview, and so on. A lot of metrics are there to help you diagnose.
The Performance Overview dashboard orchestrates the metrics of TiDB, PD, and TiKV, and presents each of them in the following sections:
Overview: Database time and SQL execution time summary. By checking different colors in the overview, you can quickly identify the database workload profile and the performance bottleneck.
Load profile: Key metrics and resource usage, including database QPS, connection information, the MySQL command types the application interacts with TiDB, database internal TSO and KV request OPS, and resource usage of the TiKV and TiDB.
Top-down latency breakdown: Query latency versus connection idle time ratio, query latency breakdown, TSO/KV request latency during execution, breakdown of write latency within TiKV.
With the Performance Overview Dashboard, you can analyze performance efficiently, and confirm whether the bottleneck of user response time is in the database. If the bottleneck is in the database, you can identify the bottleneck inside the database, with database time overview, workload profile and SQL latency breakdown. For details, see Performance Analysis and Tuning.
The following sections illustrate the metrics on the Performance Overview dashboard.
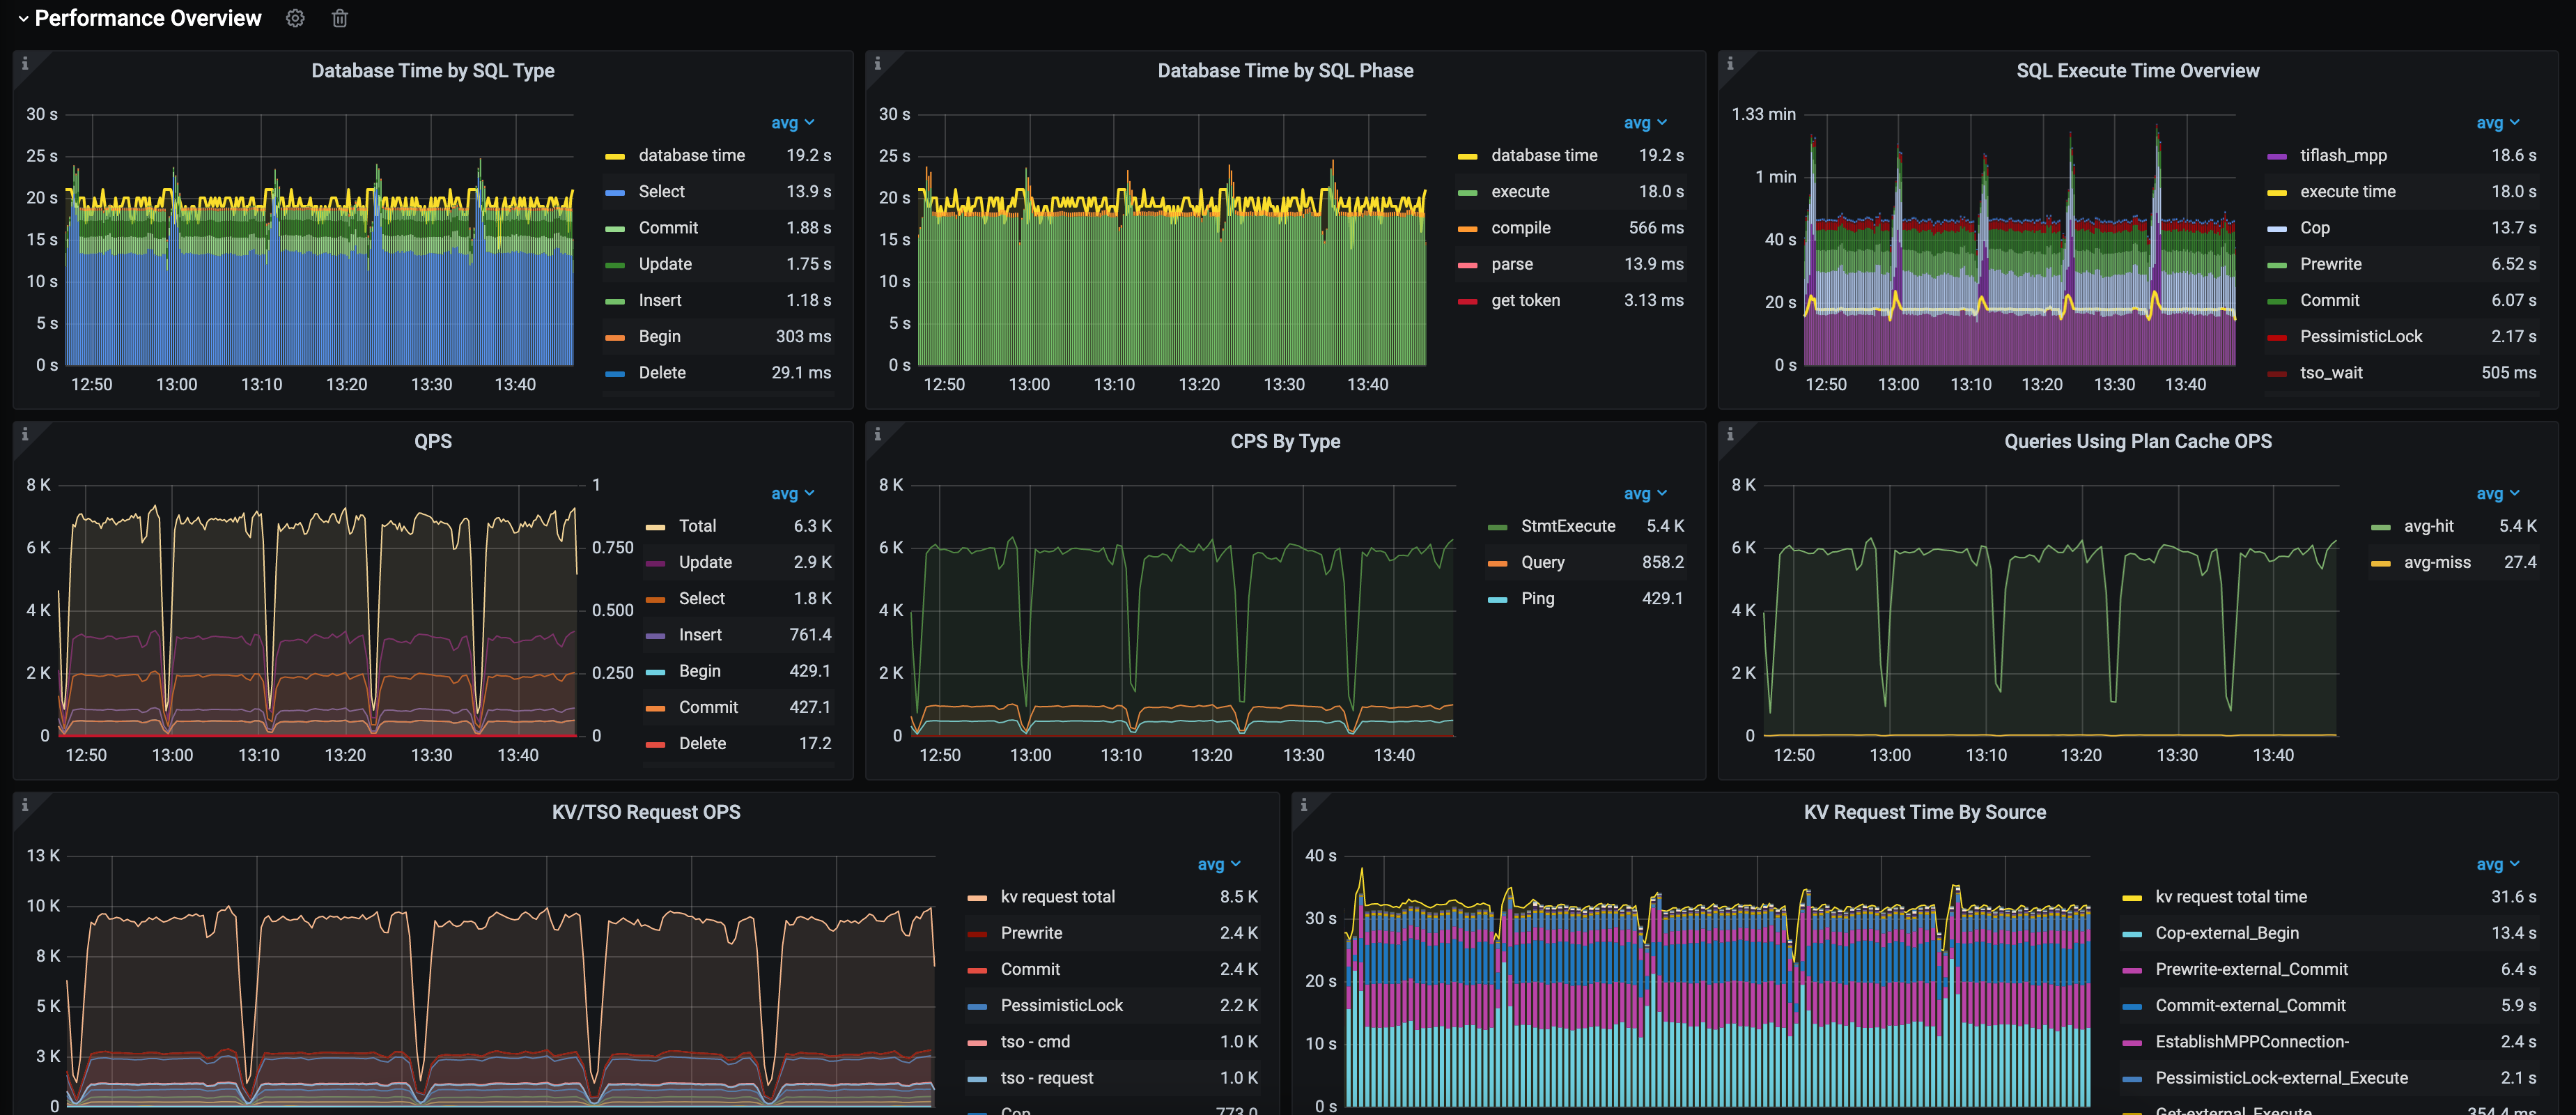
Database Time by SQL Type
- database time: Total database time per second
- sql_type: Database time consumed by each type of SQL statements per second
Database Time by SQL Phase
- database time: Total database time per second
- get token/parse/compile/execute: Database time consumed in four SQL processing phases
The SQL execution phase is in green and other phases are in red on general. If non-green areas are large, it means much database time is consumed in other phases than the execution phase and further cause analysis is required.
SQL Execute Time Overview
- execute time: Database time consumed during SQL execution per second
- tso_wait: Concurrent TSO waiting time per second during SQL execution
- kv request type: Time waiting for each KV request type per second during SQL execution. The total KV request wait time might exceed SQL execution time, because KV requests are concurrent.
Green metrics stand for common KV write requests (such as prewrite and commit), blue metrics stand for common read requests, and metrics in other colors stand for unexpected situations which you need to pay attention to. For example, pessimistic lock KV requests are marked red and TSO waiting is marked dark brown.
If non-blue or non-green areas are large, it means there is a bottleneck during SQL execution. For example:
- If serious lock conflicts occur, the red area will take a large proportion.
- If excessive time is consumed in waiting TSO, the dark brown area will take a large proportion.
QPS
Number of SQL statements executed per second in all TiDB instances, collected by type: such as SELECT, INSERT, and UPDATE
CPS By Type
Number of commands processed by all TiDB instances per second based on type
Queries Using Plan Cache OPS
Number of queries using plan cache per second in all TiDB instances
KV/TSO Request OPS
- kv request total: Total number of KV requests per second in all TiDB instances
- kv request by type: Number of KV requests per second in all TiDB instances based on such types as
Get,Prewrite, andCommit. - tso - cmd: Number of
tso cmdrequests per second in all TiDB instances - tso - request: Number of
tso requestrequests per second in all TiDB instances
Generally, dividing tso - cmd by tso - request yields the average batch size of requests per second.
Connection Count
- total: Number of connections to all TiDB instances
- active connections: Number of active connections to all TiDB instances
- Number of connections to each TiDB instance
TiDB CPU
- avg: Average CPU utilization across all TiDB instances
- delta: Maximum CPU utilization of all TiDB instances minus minimum CPU utilization of all TiDB instances
- max: Maximum CPU utilization across all TiDB instances
TiKV CPU/IO MBps
- CPU-Avg: Average CPU utilization of all TiKV instances
- CPU-Delta: Maximum CPU utilization of all TiKV instances minus minimum CPU utilization of all TiKV instances
- CPU-MAX: Maximum CPU utilization among all TiKV instances
- IO-Avg: Average MBps of all TiKV instances
- IO-Delt: Maximum MBps of all TiKV instances minus minimum MBps of all TiKV instances
- IO-MAX: Maximum MBps of all TiKV instances
Duration
Duration: Execution time
- The duration from receiving a request from the client to TiDB till TiDB executing the request and returning the result to the client. In general, client requests are sent in the form of SQL statements; however, this duration can include the execution time of commands such as
COM_PING,COM_SLEEP,COM_STMT_FETCH, andCOM_SEND_LONG_DATA. - TiDB supports Multi-Query, which means the client can send multiple SQL statements at one time, such as
select 1; select 1; select 1;. In this case, the total execution time of this query includes the execution time of all SQL statements.
- The duration from receiving a request from the client to TiDB till TiDB executing the request and returning the result to the client. In general, client requests are sent in the form of SQL statements; however, this duration can include the execution time of commands such as
avg: Average time to execute all requests
99: P99 duration to execute all requests
avg by type: Average time to execute all requests in all TiDB instances, collected by type:
SELECT,INSERT, andUPDATE
Connection Idle Duration
Connection Idle Duration indicates the duration of a connection being idle.
- avg-in-txn: Average connection idle duration when the connection is within a transaction
- avg-not-in-txn: Average connection idle duration when the connection is not within a transaction
- 99-in-txn: P99 connection idle duration when the connection is within a transaction
- 99-not-in-txn: P99 connection idle duration when the connection is not within a transaction
Parse Duration, Compile Duration, and Execute Duration
- Parse Duration: Time consumed in parsing SQL statements
- Compile Duration: Time consumed in compiling the parsed SQL AST to execution plans
- Execution Duration: Time consumed in executing execution plans of SQL statements
All these three metrics include the average duration and the 99th percentile duration in all TiDB instances.
Avg TiDB KV Request Duration
Average time consumed in executing KV requests in all TiDB instances based on the type, including Get, Prewrite, and Commit.
Avg TiKV GRPC Duration
Average time consumed in executing gRPC requests in all TiKV instances based on the type, including kv_get, kv_prewrite, and kv_commit.
PD TSO Wait/RPC Duration
- wait - avg: Average time in waiting for PD to return TSO in all TiDB instances
- rpc - avg: Average time from sending TSO requests to PD to receiving TSO in all TiDB instances
- wait - 99: P99 time in waiting for PD to return TSO in all TiDB instances
- rpc - 99: P99 time from sending TSO requests to PD to receiving TSO in all TiDB instances
Storage Async Write Duration, Store Duration, and Apply Duration
- Storage Async Write Duration: Time consumed in asynchronous write
- Store Duration: Time consumed in store loop during asynchronously write
- Apply Duration: Time consumed in apply loop during asynchronously write
All these three metrics include the average duration and P99 duration in all TiKV instances.
Average storage async write duration = Average store duration + Average apply duration
Append Log Duration, Commit Log Duration, and Apply Log Duration
- Append Log Duration: Time consumed by Raft to append logs
- Commit Log Duration: Time consumed by Raft to commit logs
- Apply Log Duration: Time consumed by Raft to apply logs
All these three metrics include the average duration and P99 duration in all TiKV instances.
Interface of the Performance Overview dashboard
- Database Time by SQL Type
- Database Time by SQL Phase
- SQL Execute Time Overview
- QPS
- CPS By Type
- Queries Using Plan Cache OPS
- KV/TSO Request OPS
- Connection Count
- TiDB CPU
- TiKV CPU/IO MBps
- Duration
- Connection Idle Duration
- Parse Duration, Compile Duration, and Execute Duration
- Avg TiDB KV Request Duration
- Avg TiKV GRPC Duration
- PD TSO Wait/RPC Duration
- Storage Async Write Duration, Store Duration, and Apply Duration
- Append Log Duration, Commit Log Duration, and Apply Log Duration
- Interface of the Performance Overview dashboard