- Docs Home
- About TiDB
- Quick Start
- Develop
- Overview
- Quick Start
- Build a TiDB Cluster in TiDB Cloud (Developer Tier)
- CRUD SQL in TiDB
- Build a Simple CRUD App with TiDB
- Example Applications
- Connect to TiDB
- Design Database Schema
- Write Data
- Read Data
- Transaction
- Optimize
- Troubleshoot
- Reference
- Cloud Native Development Environment
- Third-party Support
- Deploy
- Software and Hardware Requirements
- Environment Configuration Checklist
- Plan Cluster Topology
- Install and Start
- Verify Cluster Status
- Test Cluster Performance
- Migrate
- Overview
- Migration Tools
- Migration Scenarios
- Migrate from Aurora
- Migrate MySQL of Small Datasets
- Migrate MySQL of Large Datasets
- Migrate and Merge MySQL Shards of Small Datasets
- Migrate and Merge MySQL Shards of Large Datasets
- Migrate from CSV Files
- Migrate from SQL Files
- Migrate from One TiDB Cluster to Another TiDB Cluster
- Migrate from TiDB to MySQL-compatible Databases
- Advanced Migration
- Integrate
- Maintain
- Monitor and Alert
- Troubleshoot
- TiDB Troubleshooting Map
- Identify Slow Queries
- Analyze Slow Queries
- SQL Diagnostics
- Identify Expensive Queries Using Top SQL
- Identify Expensive Queries Using Logs
- Statement Summary Tables
- Troubleshoot Hotspot Issues
- Troubleshoot Increased Read and Write Latency
- Save and Restore the On-Site Information of a Cluster
- Troubleshoot Cluster Setup
- Troubleshoot High Disk I/O Usage
- Troubleshoot Lock Conflicts
- Troubleshoot TiFlash
- Troubleshoot Write Conflicts in Optimistic Transactions
- Troubleshoot Inconsistency Between Data and Indexes
- Performance Tuning
- Tuning Guide
- Configuration Tuning
- System Tuning
- Software Tuning
- SQL Tuning
- Overview
- Understanding the Query Execution Plan
- SQL Optimization Process
- Overview
- Logic Optimization
- Physical Optimization
- Prepare Execution Plan Cache
- Control Execution Plans
- Tutorials
- TiDB Tools
- Overview
- Use Cases
- Download
- TiUP
- Documentation Map
- Overview
- Terminology and Concepts
- Manage TiUP Components
- FAQ
- Troubleshooting Guide
- Command Reference
- Overview
- TiUP Commands
- TiUP Cluster Commands
- Overview
- tiup cluster audit
- tiup cluster check
- tiup cluster clean
- tiup cluster deploy
- tiup cluster destroy
- tiup cluster disable
- tiup cluster display
- tiup cluster edit-config
- tiup cluster enable
- tiup cluster help
- tiup cluster import
- tiup cluster list
- tiup cluster patch
- tiup cluster prune
- tiup cluster reload
- tiup cluster rename
- tiup cluster replay
- tiup cluster restart
- tiup cluster scale-in
- tiup cluster scale-out
- tiup cluster start
- tiup cluster stop
- tiup cluster template
- tiup cluster upgrade
- TiUP DM Commands
- Overview
- tiup dm audit
- tiup dm deploy
- tiup dm destroy
- tiup dm disable
- tiup dm display
- tiup dm edit-config
- tiup dm enable
- tiup dm help
- tiup dm import
- tiup dm list
- tiup dm patch
- tiup dm prune
- tiup dm reload
- tiup dm replay
- tiup dm restart
- tiup dm scale-in
- tiup dm scale-out
- tiup dm start
- tiup dm stop
- tiup dm template
- tiup dm upgrade
- TiDB Cluster Topology Reference
- DM Cluster Topology Reference
- Mirror Reference Guide
- TiUP Components
- PingCAP Clinic Diagnostic Service
- TiDB Operator
- Dumpling
- TiDB Lightning
- TiDB Data Migration
- About TiDB Data Migration
- Architecture
- Quick Start
- Deploy a DM cluster
- Tutorials
- Advanced Tutorials
- Maintain
- Cluster Upgrade
- Tools
- Performance Tuning
- Manage Data Sources
- Manage Tasks
- Export and Import Data Sources and Task Configurations of Clusters
- Handle Alerts
- Daily Check
- Reference
- Architecture
- Command Line
- Configuration Files
- OpenAPI
- Compatibility Catalog
- Secure
- Monitoring and Alerts
- Error Codes
- Glossary
- Example
- Troubleshoot
- Release Notes
- Backup & Restore (BR)
- TiDB Binlog
- TiCDC
- Dumpling
- sync-diff-inspector
- TiSpark
- Reference
- Cluster Architecture
- Key Monitoring Metrics
- Secure
- Privileges
- SQL
- SQL Language Structure and Syntax
- SQL Statements
ADD COLUMNADD INDEXADMINADMIN CANCEL DDLADMIN CHECKSUM TABLEADMIN CHECK [TABLE|INDEX]ADMIN SHOW DDL [JOBS|QUERIES]ADMIN SHOW TELEMETRYALTER DATABASEALTER INDEXALTER INSTANCEALTER PLACEMENT POLICYALTER TABLEALTER TABLE COMPACTALTER USERANALYZE TABLEBACKUPBATCHBEGINCHANGE COLUMNCOMMITCHANGE DRAINERCHANGE PUMPCREATE [GLOBAL|SESSION] BINDINGCREATE DATABASECREATE INDEXCREATE PLACEMENT POLICYCREATE ROLECREATE SEQUENCECREATE TABLE LIKECREATE TABLECREATE USERCREATE VIEWDEALLOCATEDELETEDESCDESCRIBEDODROP [GLOBAL|SESSION] BINDINGDROP COLUMNDROP DATABASEDROP INDEXDROP PLACEMENT POLICYDROP ROLEDROP SEQUENCEDROP STATSDROP TABLEDROP USERDROP VIEWEXECUTEEXPLAIN ANALYZEEXPLAINFLASHBACK TABLEFLUSH PRIVILEGESFLUSH STATUSFLUSH TABLESGRANT <privileges>GRANT <role>INSERTKILL [TIDB]LOAD DATALOAD STATSMODIFY COLUMNPREPARERECOVER TABLERENAME INDEXRENAME TABLEREPLACERESTOREREVOKE <privileges>REVOKE <role>ROLLBACKSELECTSET DEFAULT ROLESET [NAMES|CHARACTER SET]SET PASSWORDSET ROLESET TRANSACTIONSET [GLOBAL|SESSION] <variable>SHOW ANALYZE STATUSSHOW [BACKUPS|RESTORES]SHOW [GLOBAL|SESSION] BINDINGSSHOW BUILTINSSHOW CHARACTER SETSHOW COLLATIONSHOW [FULL] COLUMNS FROMSHOW CONFIGSHOW CREATE PLACEMENT POLICYSHOW CREATE SEQUENCESHOW CREATE TABLESHOW CREATE USERSHOW DATABASESSHOW DRAINER STATUSSHOW ENGINESSHOW ERRORSSHOW [FULL] FIELDS FROMSHOW GRANTSSHOW INDEX [FROM|IN]SHOW INDEXES [FROM|IN]SHOW KEYS [FROM|IN]SHOW MASTER STATUSSHOW PLACEMENTSHOW PLACEMENT FORSHOW PLACEMENT LABELSSHOW PLUGINSSHOW PRIVILEGESSHOW [FULL] PROCESSSLISTSHOW PROFILESSHOW PUMP STATUSSHOW SCHEMASSHOW STATS_HEALTHYSHOW STATS_HISTOGRAMSSHOW STATS_METASHOW STATUSSHOW TABLE NEXT_ROW_IDSHOW TABLE REGIONSSHOW TABLE STATUSSHOW [FULL] TABLESSHOW [GLOBAL|SESSION] VARIABLESSHOW WARNINGSSHUTDOWNSPLIT REGIONSTART TRANSACTIONTABLETRACETRUNCATEUPDATEUSEWITH
- Data Types
- Functions and Operators
- Overview
- Type Conversion in Expression Evaluation
- Operators
- Control Flow Functions
- String Functions
- Numeric Functions and Operators
- Date and Time Functions
- Bit Functions and Operators
- Cast Functions and Operators
- Encryption and Compression Functions
- Locking Functions
- Information Functions
- JSON Functions
- Aggregate (GROUP BY) Functions
- Window Functions
- Miscellaneous Functions
- Precision Math
- Set Operations
- List of Expressions for Pushdown
- TiDB Specific Functions
- Clustered Indexes
- Constraints
- Generated Columns
- SQL Mode
- Table Attributes
- Transactions
- Garbage Collection (GC)
- Views
- Partitioning
- Temporary Tables
- Cached Tables
- Character Set and Collation
- Placement Rules in SQL
- System Tables
mysql- INFORMATION_SCHEMA
- Overview
ANALYZE_STATUSCLIENT_ERRORS_SUMMARY_BY_HOSTCLIENT_ERRORS_SUMMARY_BY_USERCLIENT_ERRORS_SUMMARY_GLOBALCHARACTER_SETSCLUSTER_CONFIGCLUSTER_HARDWARECLUSTER_INFOCLUSTER_LOADCLUSTER_LOGCLUSTER_SYSTEMINFOCOLLATIONSCOLLATION_CHARACTER_SET_APPLICABILITYCOLUMNSDATA_LOCK_WAITSDDL_JOBSDEADLOCKSENGINESINSPECTION_RESULTINSPECTION_RULESINSPECTION_SUMMARYKEY_COLUMN_USAGEMETRICS_SUMMARYMETRICS_TABLESPARTITIONSPLACEMENT_POLICIESPROCESSLISTREFERENTIAL_CONSTRAINTSSCHEMATASEQUENCESSESSION_VARIABLESSLOW_QUERYSTATISTICSTABLESTABLE_CONSTRAINTSTABLE_STORAGE_STATSTIDB_HOT_REGIONSTIDB_HOT_REGIONS_HISTORYTIDB_INDEXESTIDB_SERVERS_INFOTIDB_TRXTIFLASH_REPLICATIKV_REGION_PEERSTIKV_REGION_STATUSTIKV_STORE_STATUSUSER_PRIVILEGESVIEWS
METRICS_SCHEMA
- UI
- TiDB Dashboard
- Overview
- Maintain
- Access
- Overview Page
- Cluster Info Page
- Top SQL Page
- Key Visualizer Page
- Metrics Relation Graph
- SQL Statements Analysis
- Slow Queries Page
- Cluster Diagnostics
- Search Logs Page
- Instance Profiling
- Session Management and Configuration
- FAQ
- CLI
- Command Line Flags
- Configuration File Parameters
- System Variables
- Storage Engines
- Telemetry
- Errors Codes
- Table Filter
- Schedule Replicas by Topology Labels
- FAQs
- Release Notes
- All Releases
- Release Timeline
- TiDB Versioning
- v6.1
- v6.0
- v5.4
- v5.3
- v5.2
- v5.1
- v5.0
- v4.0
- v3.1
- v3.0
- v2.1
- v2.0
- v1.0
- Glossary
Key Monitoring Metrics of TiCDC
If you use TiUP to deploy the TiDB cluster, you can see a sub-dashboard for TiCDC in the monitoring system which is deployed at the same time. You can get an overview of TiCDC's current status from the TiCDC dashboard, where the key metrics are displayed. This document provides a detailed description of these key metrics.
The metric description in this document is based on the following replication task example, which replicates data to MySQL using the default configuration.
cdc cli changefeed create --pd=http://10.0.10.25:2379 --sink-uri="mysql://root:123456@127.0.0.1:3306/" --changefeed-id="simple-replication-task"
The TiCDC dashboard contains four monitoring panels. See the following screenshot:
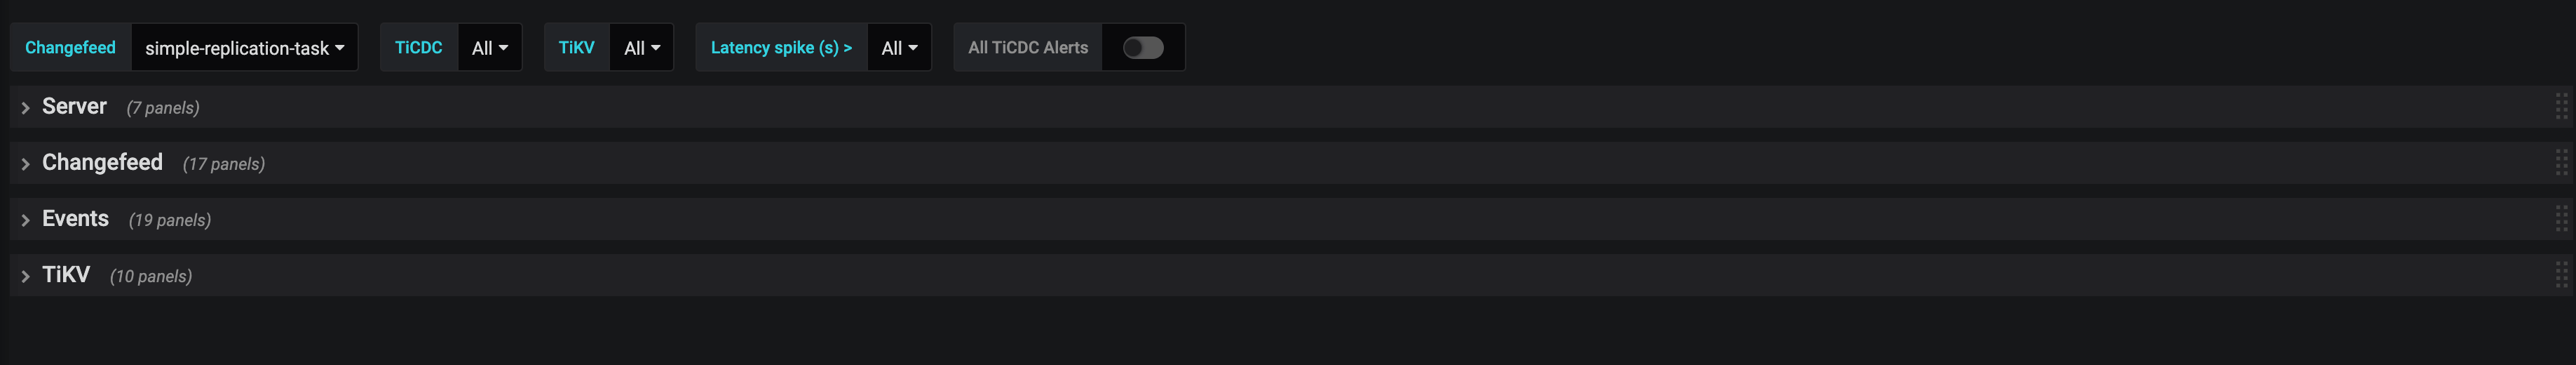
The description of each panel is as follows:
- Server: The summary information of TiKV nodes and TiCDC nodes in the TiDB cluster
- Changefeed: The detailed information of TiCDC replication tasks
- Events: The detail information about the data flow within the TiCDC cluster
- TiKV: TiKV information related to TiCDC
Server
The following is an example of the Server panel:
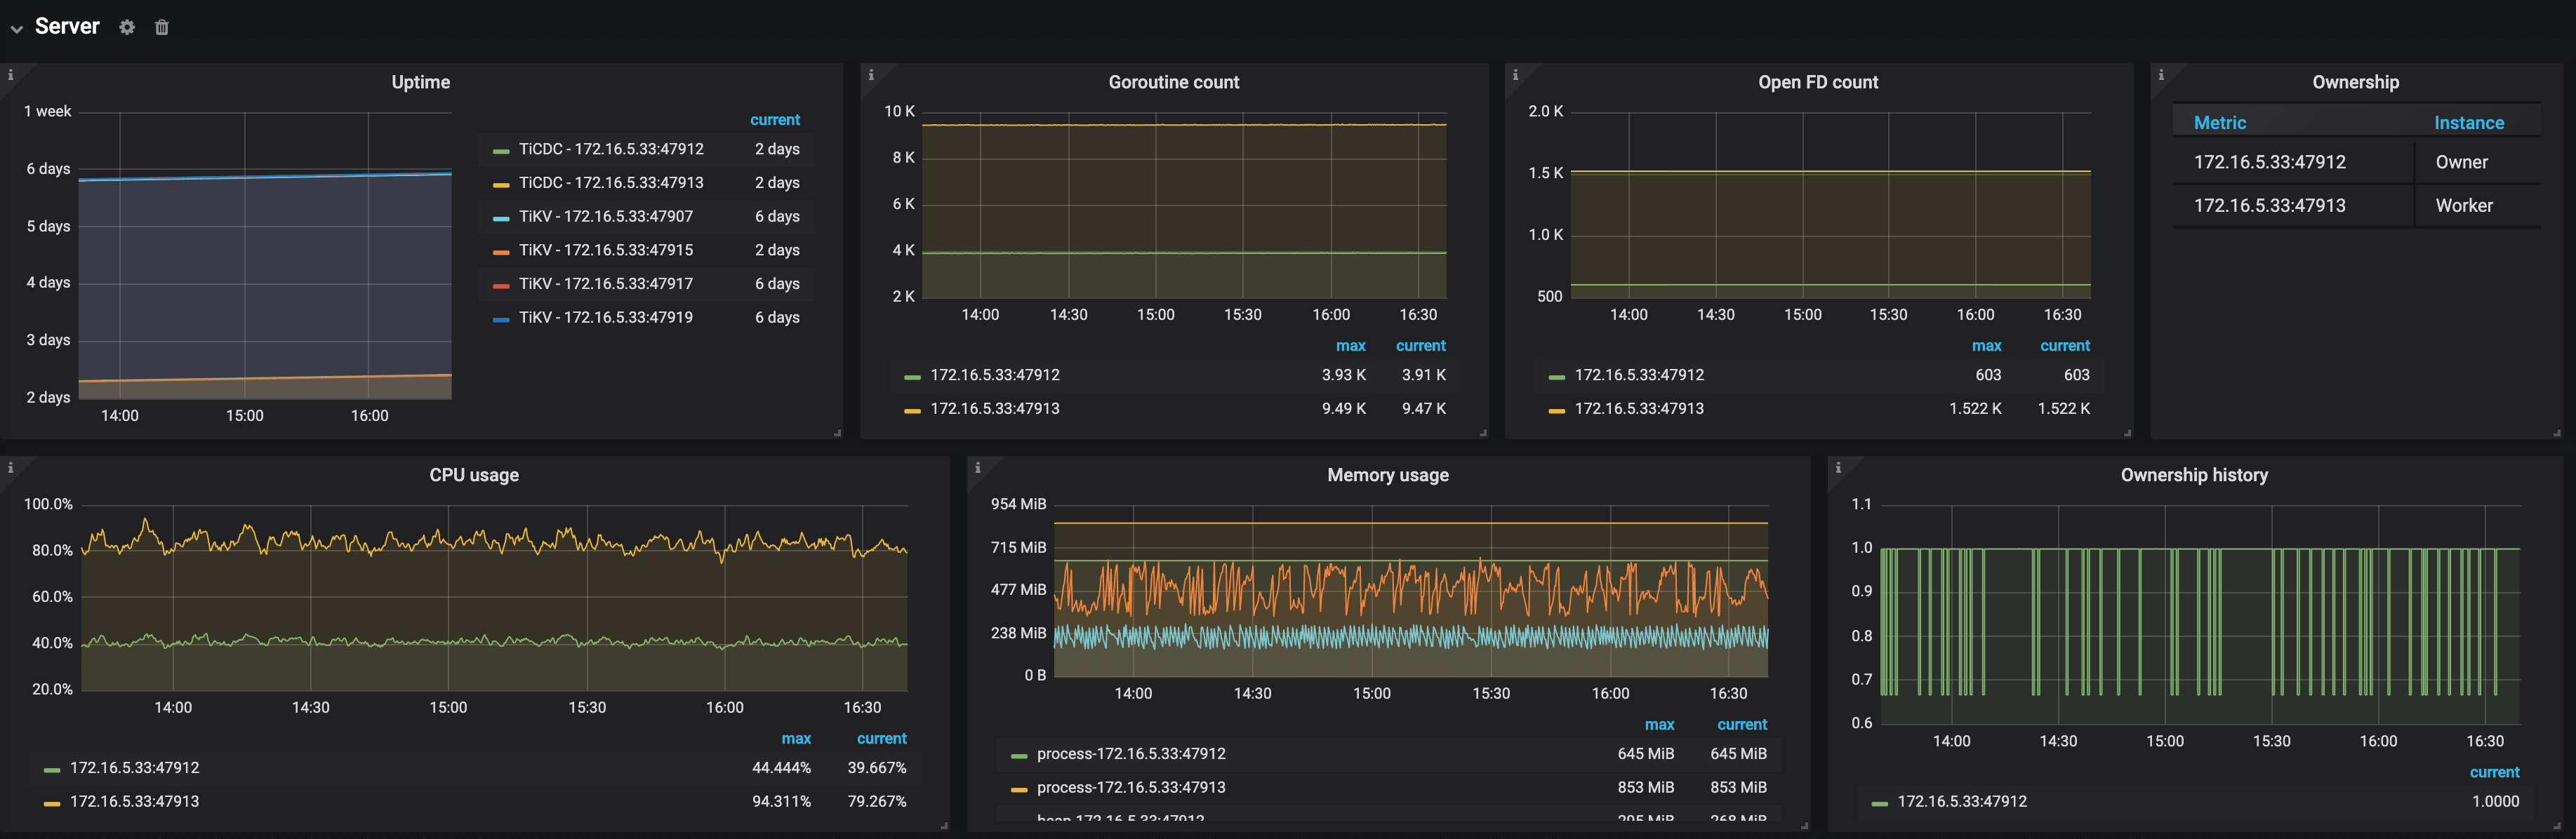
The description of each metric in the Server panel is as follows:
- Uptime: The time for which TiKV nodes and TiCDC nodes have been running
- Goroutine count: The number of goroutines of a TiCDC node
- Open FD count: The number of file handles opened by TiCDC nodes
- Ownership: The current status of nodes in the TiCDC cluster
- Ownership history: The ownership history of the TiCDC cluster
- CPU usage: The CPU usage of TiCDC nodes
- Memory usage: The memory usage of TiCDC nodes
Changefeed
The following is an example of the Changefeed panel:
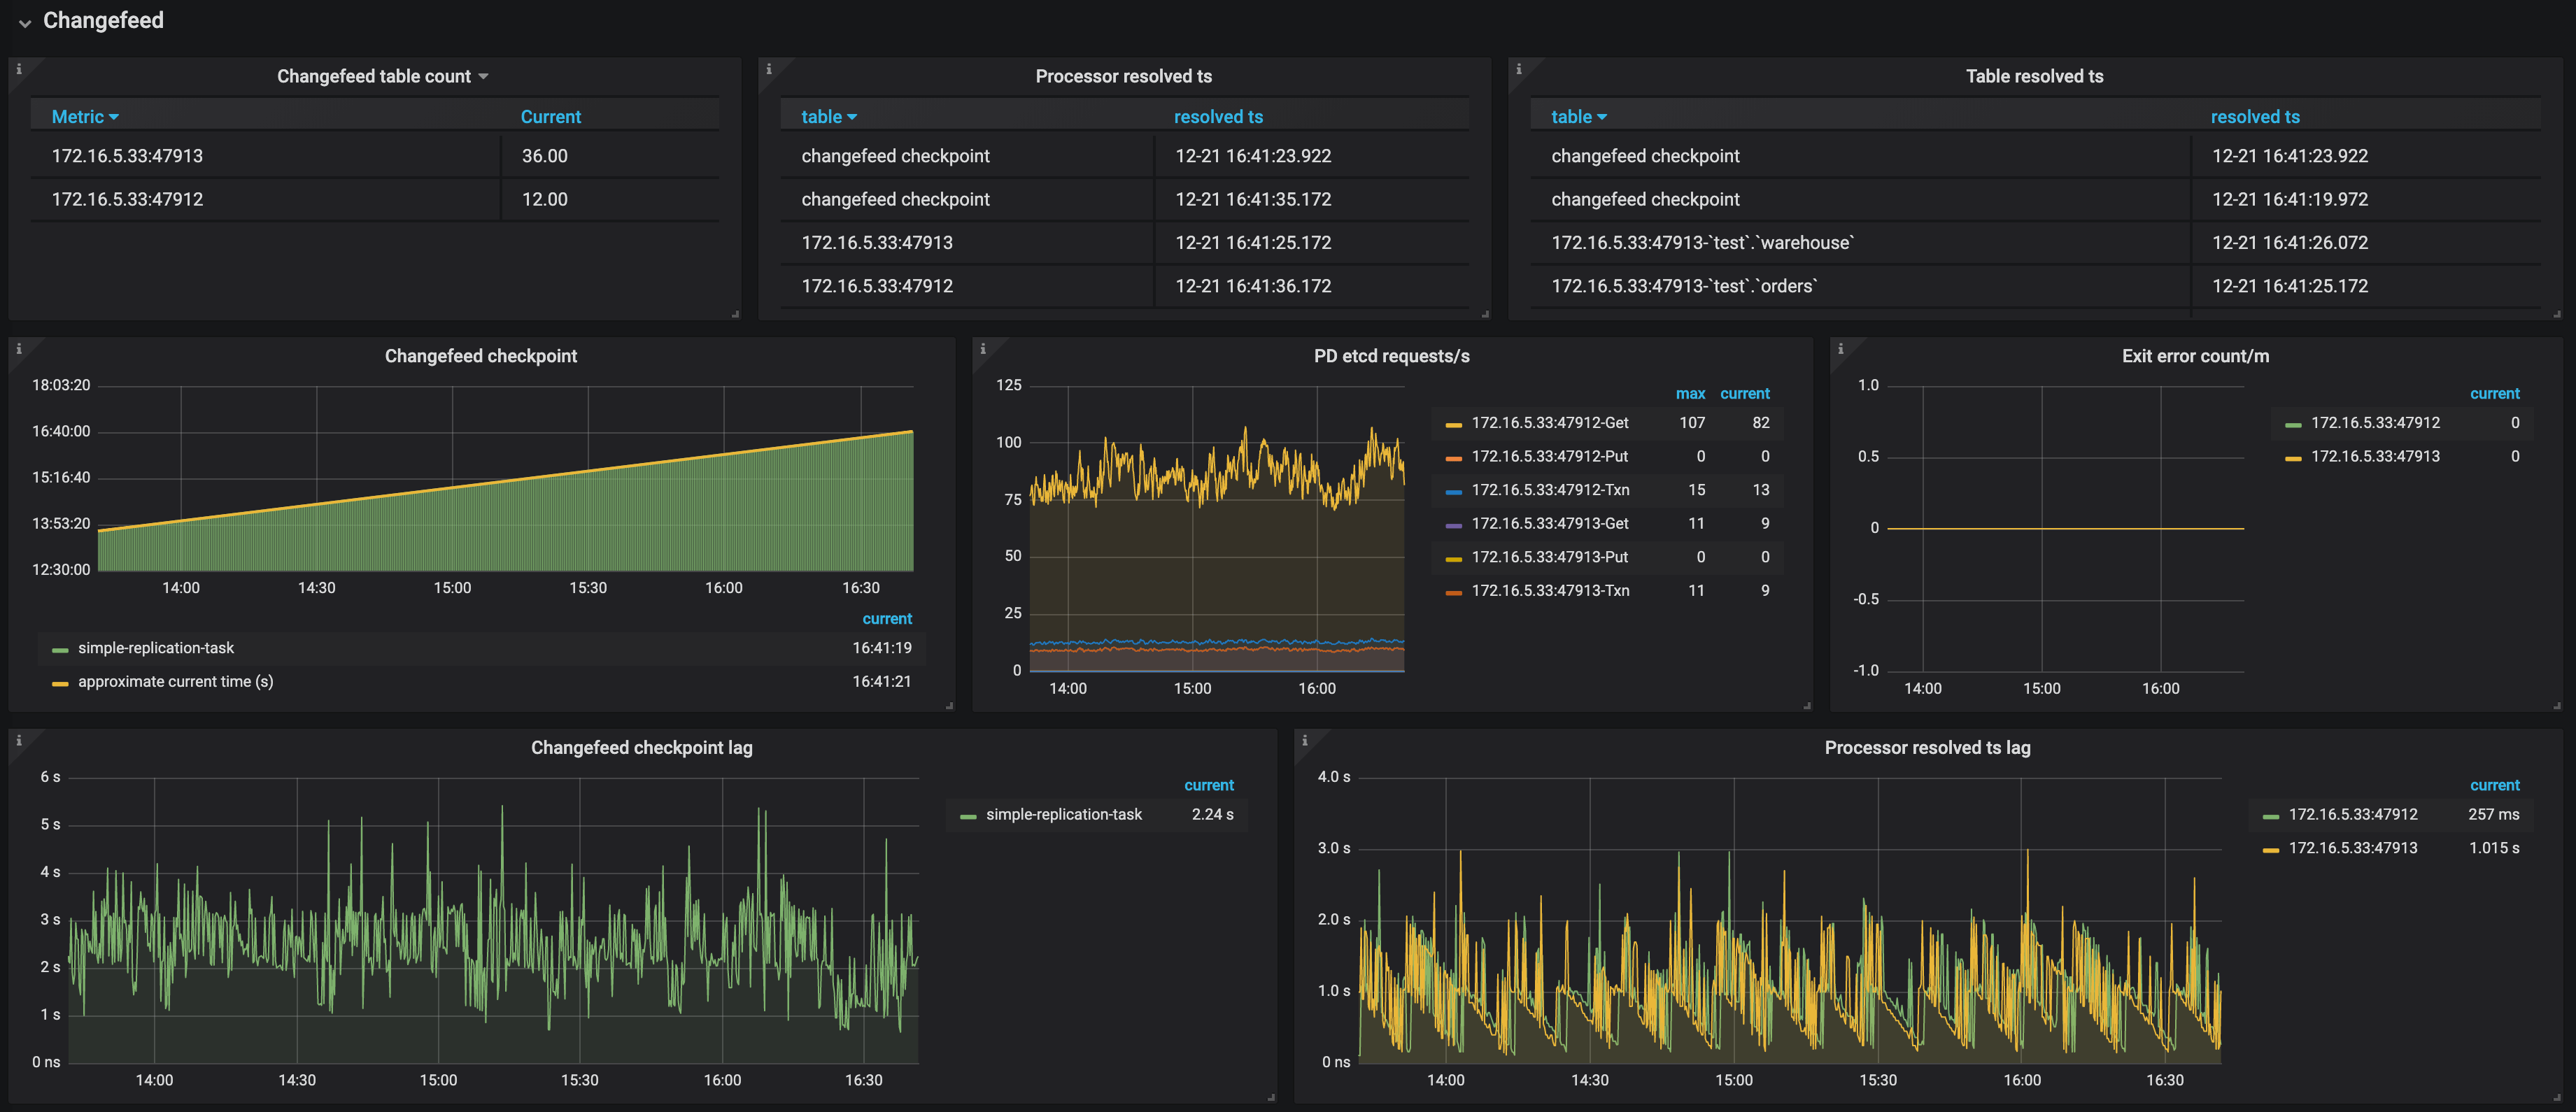
The description of each metric in the Changefeed panel is as follows:
- Changefeed table count: The number of tables that each TiCDC node needs to replicate in the replication task
- Processor resolved ts: The timestamps that have been resolved in the TiCDC cluster
- Table resolved ts: The replication progress of each table in the replication task
- Changefeed checkpoint: The progress of replicating data to the downstream. Normally, the green bars are connected to the yellow line
- PD etcd requests/s: The number of requests that a TiCDC node sends to PD per second
- Exit error count: The number of errors that interrupt the replication task per minute
- Changefeed checkpoint lag: The progress lag of data replication (the unit is second) between the upstream and the downstream
- Changefeed resolved ts lag: The progress lag of data replication (the unit is second) between the upstream and TiCDC nodes
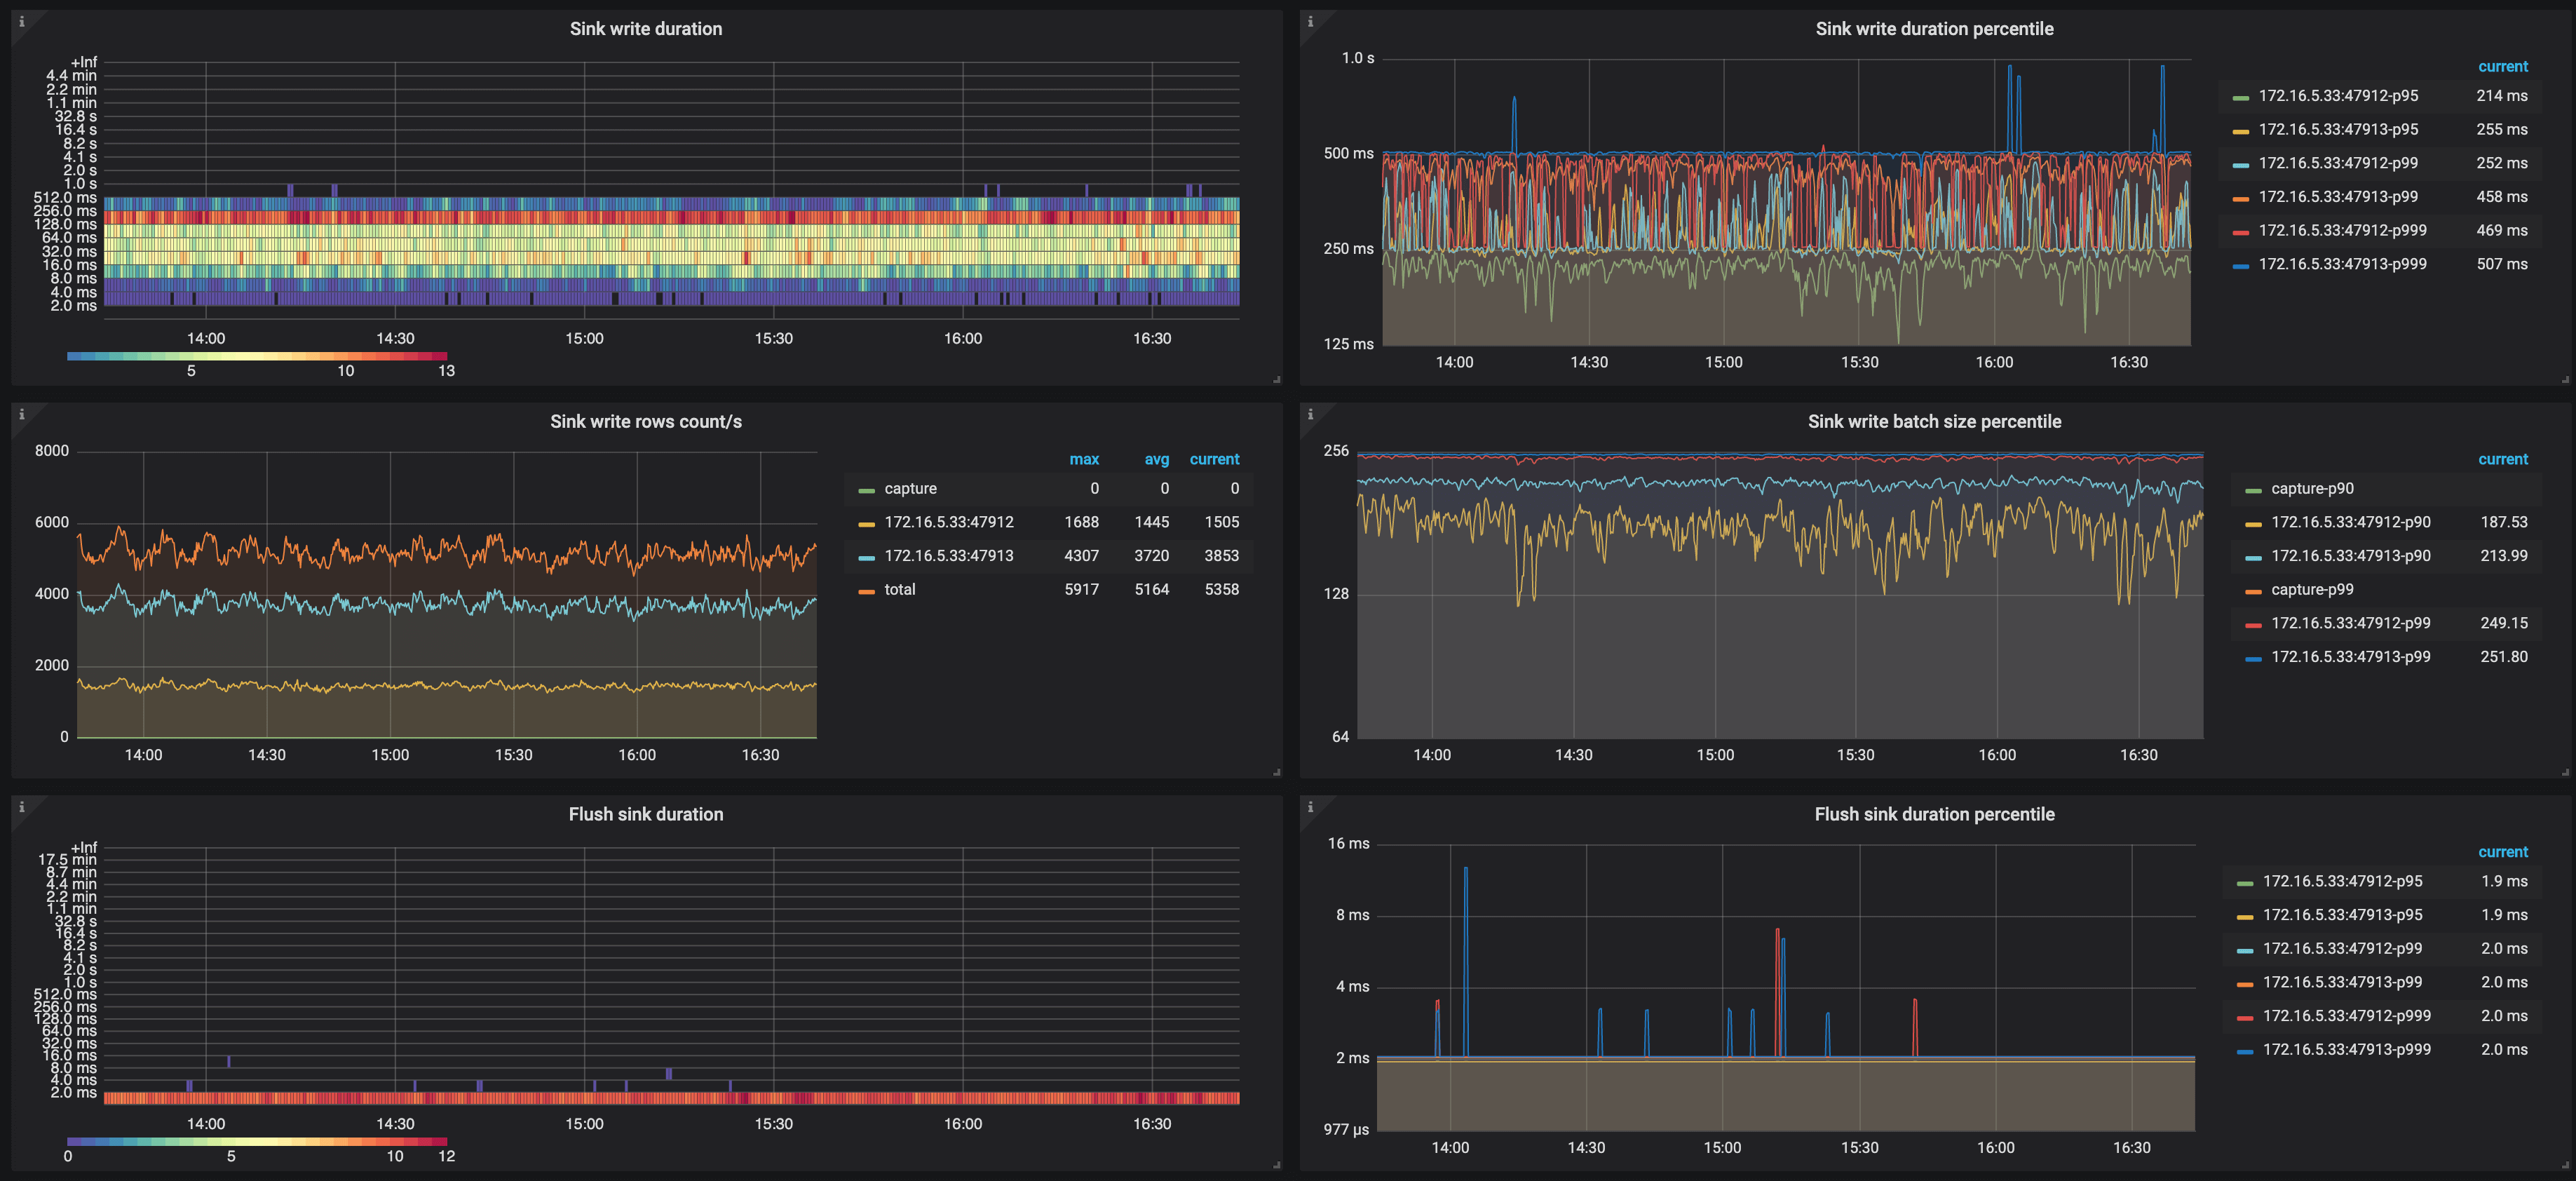
- Flush sink duration: The histogram of the time spent by TiCDC asynchronously flushing data to the downstream
- Flush sink duration percentile: The time (P95, P99, and P999) spent by TiCDC asynchronously flushing data to the downstream within one second
- Sink write duration: The histogram of the time spent by TiCDC writing a transaction change to the downstream
- Sink write duration percentile: The time (P95, P99, and P999) spent by TiCDC writing a transaction change to the downstream within one second
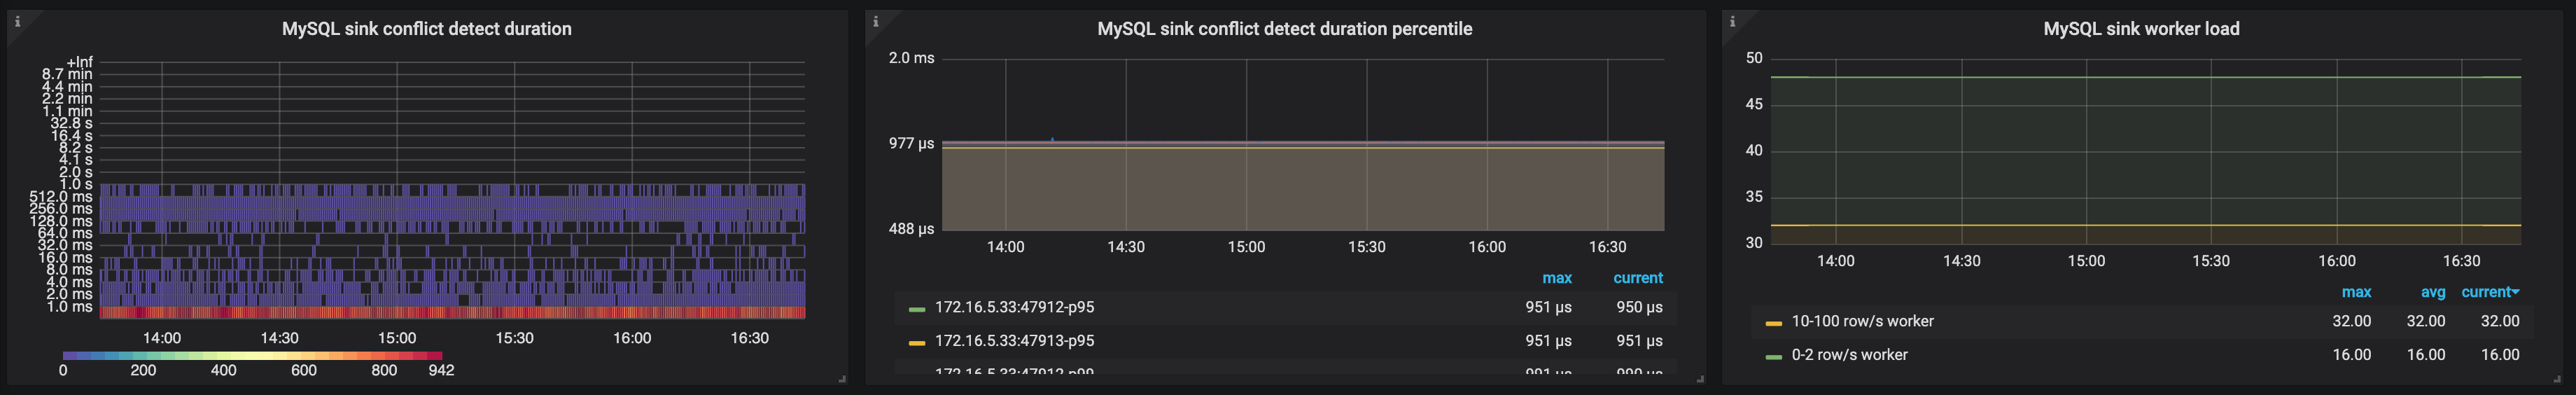
- MySQL sink conflict detect duration: The histogram of the time spent on detecting MySQL sink conflicts
- MySQL sink conflict detect duration percentile: The time (P95, P99, and P999) spent on detecting MySQL sink conflicts within one second
- MySQL sink worker load: The workload of MySQL sink workers of TiCDC nodes
Events
The following is an example of the Events panel:
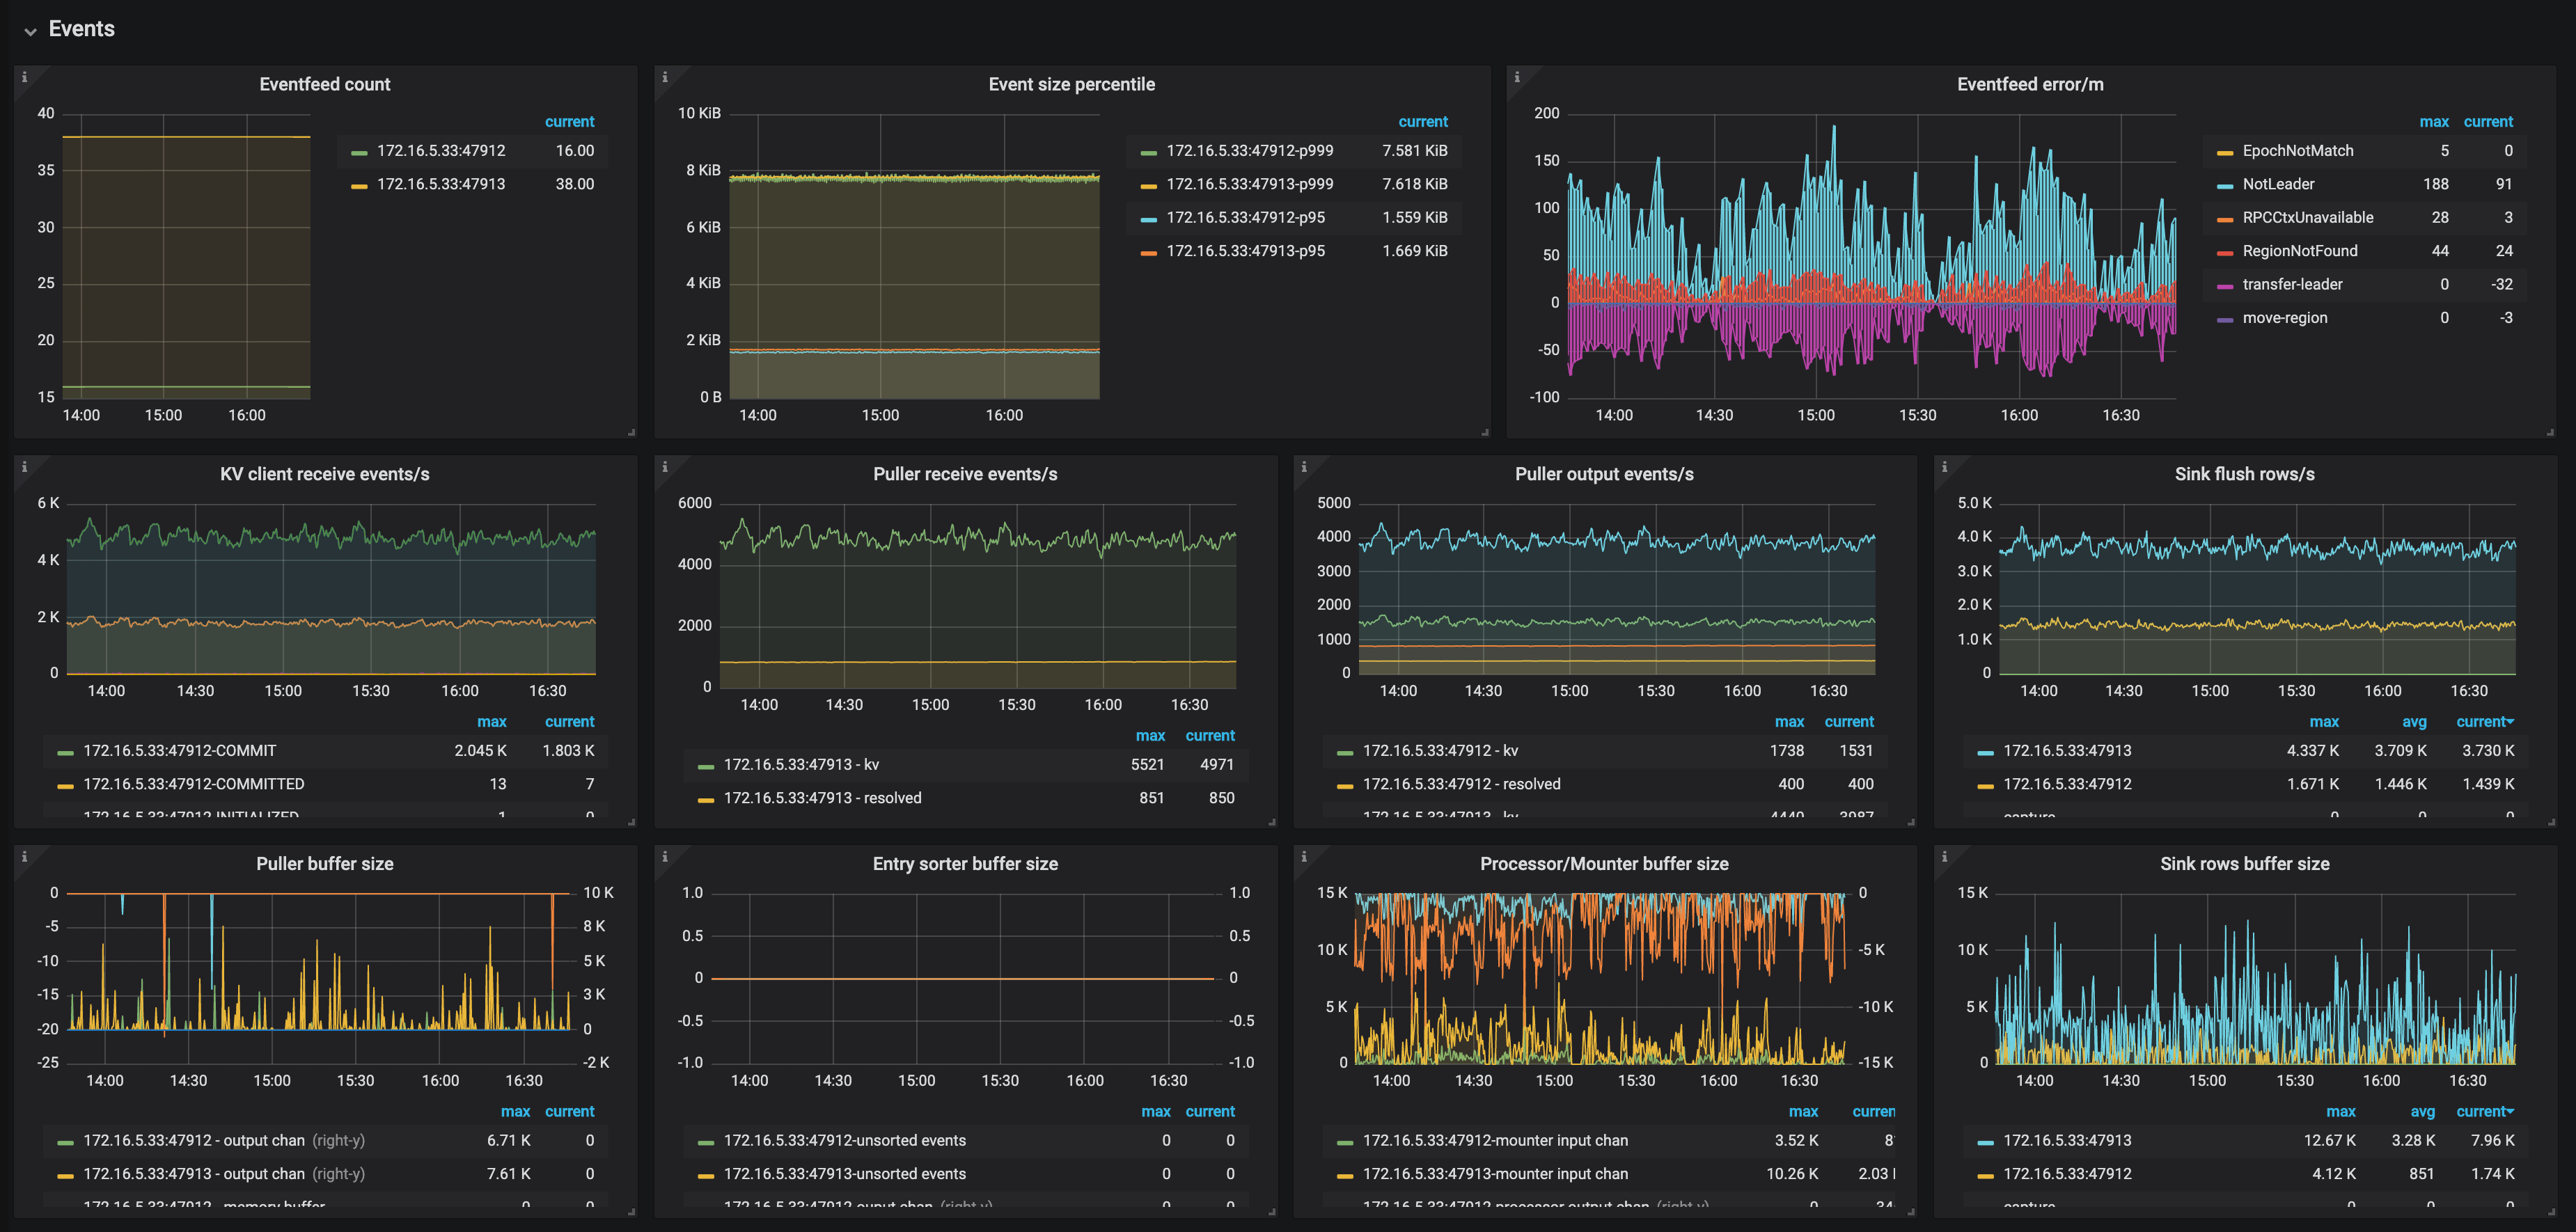
The description of each metric in the Events panel is as follows:
- Eventfeed count: The number of Eventfeed RPC requests of TiCDC nodes
- Event size percentile: The event size (P95, P99, and P999) which TiCDC receives from TiKV within one second
- Eventfeed error/m: The number of errors reported by Eventfeed RPC requests of TiCDC nodes per minute
- KV client receive events/s: The number of events that the KV client module of TiCDC nodes receives from TiKV per second
- Puller receive events/s: The number of events that the Puller module of TiCDC nodes receives from the KV client per second
- Puller output events/s: The number of events that the Puller module of TiCDC nodes sends to the Sorter module per second
- Sink flush rows/s: The number of events that TiCDC nodes write to the downstream per second
- Puller buffer size: The number of events that TiCDC nodes cache in the Puller module
- Entry sorter buffer size: The number of events that TiCDC nodes cache in the Sorter module
- Processor/Mounter buffer size: The number of events that TiCDC nodes cache in the Processor module and the Mounter module
- Sink row buffer size: The number of events that TiCDC nodes cache in the Sink module
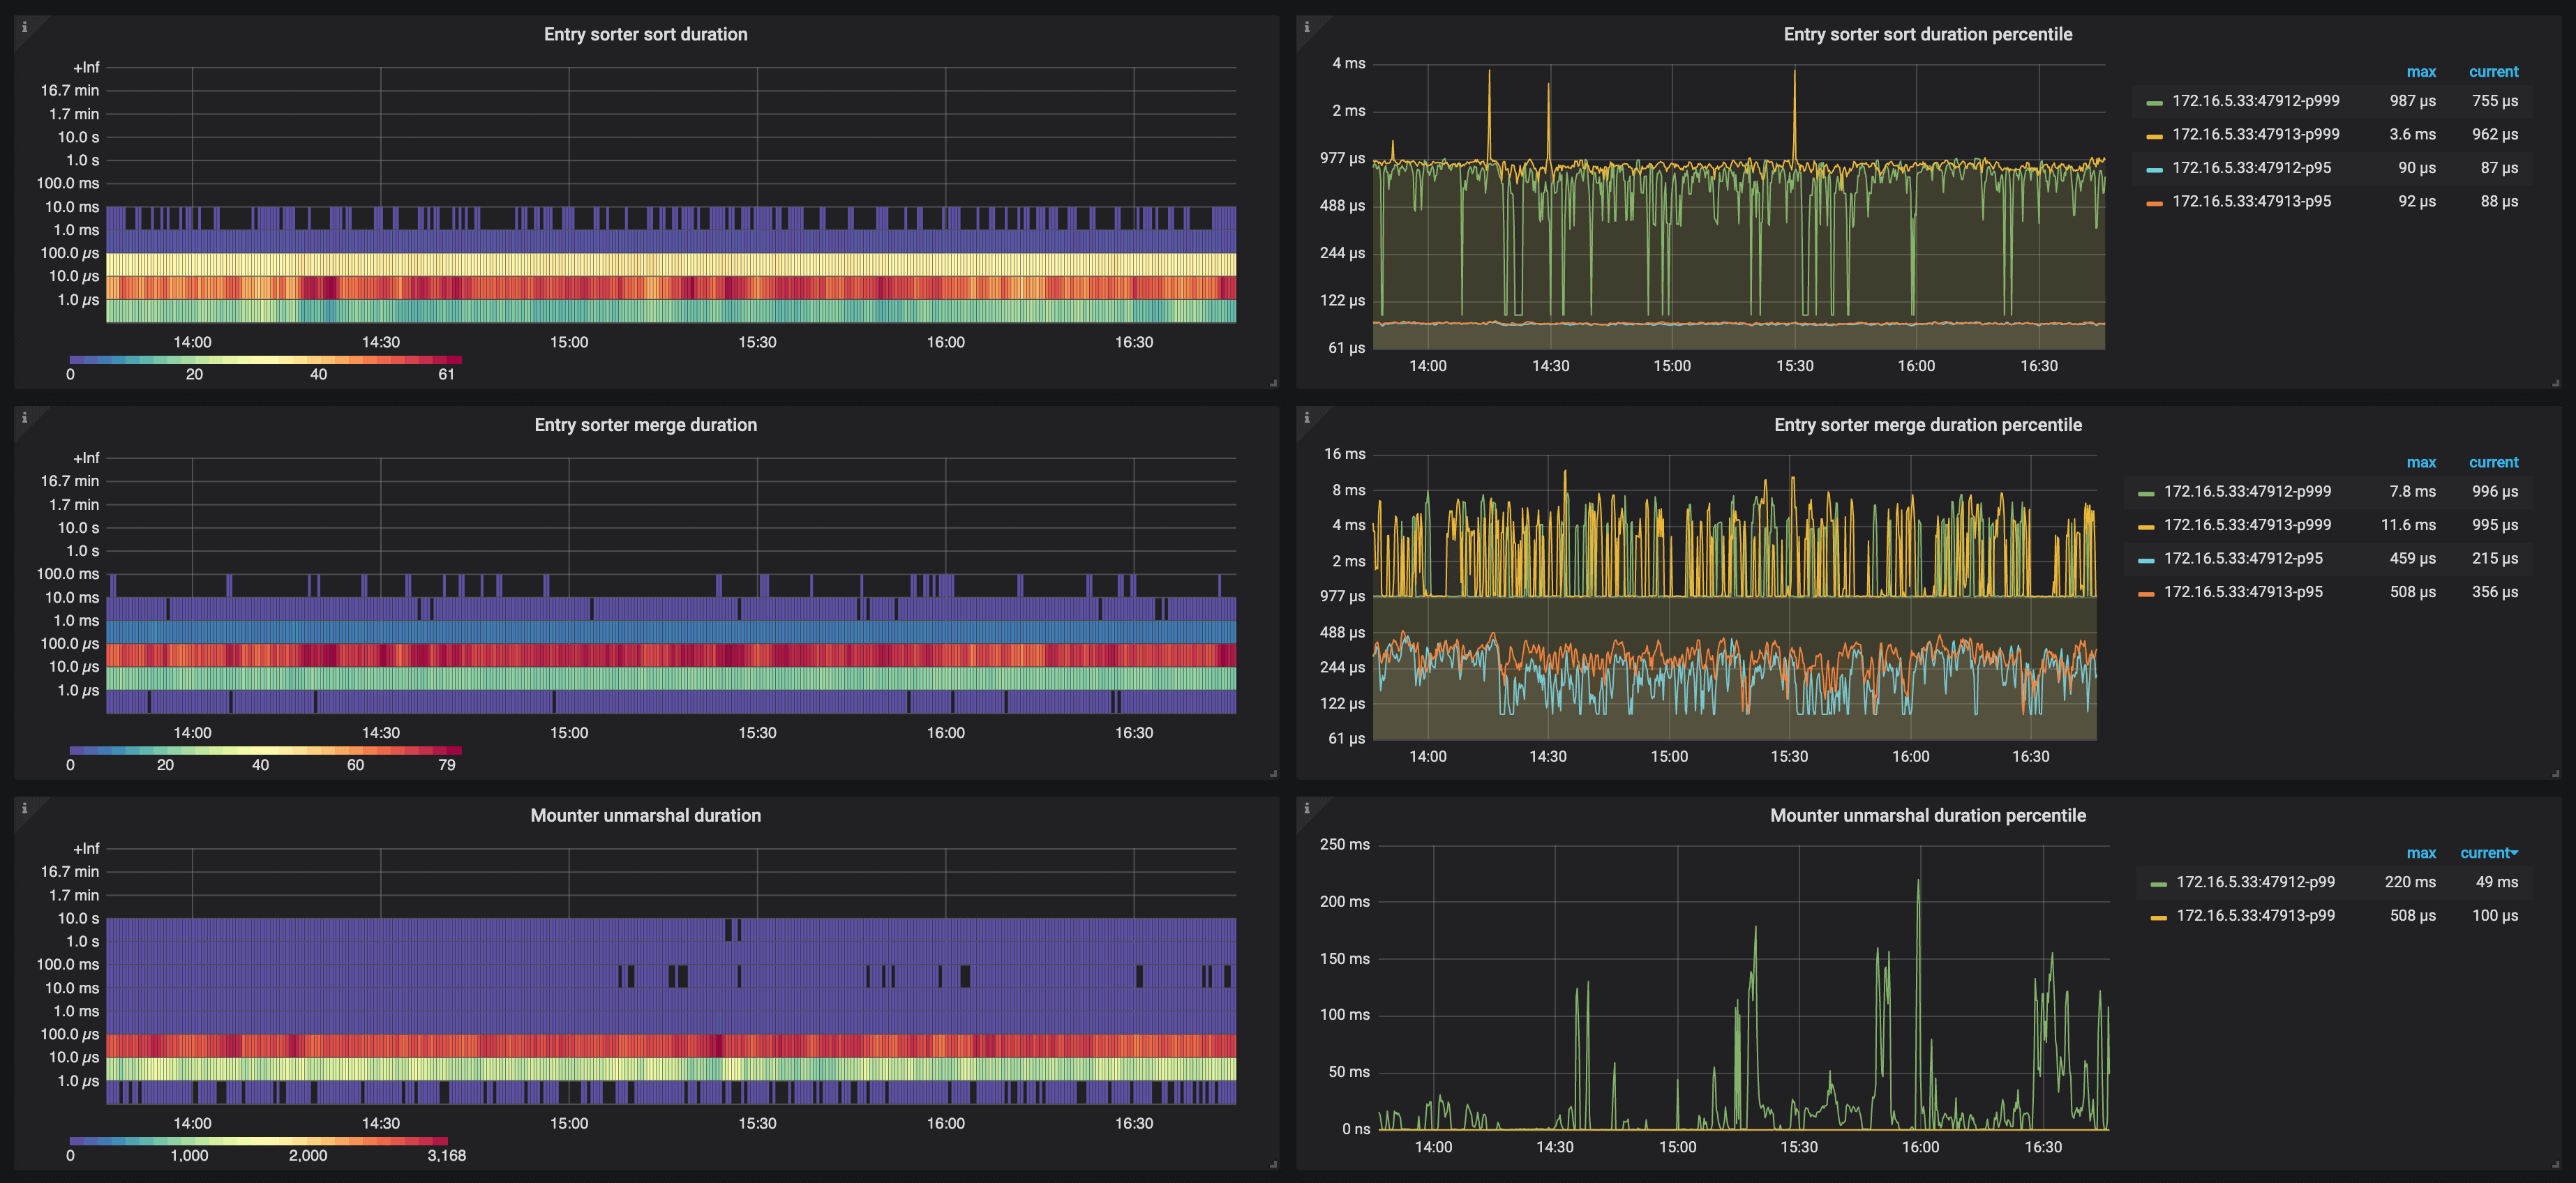
- Entry sorter sort duration: The histogram of the time spent by TiCDC nodes sorting events
- Entry sorter sort duration percentile: The time (P95, P99, and P999) spent by TiCDC sorting events within one second
- Entry sorter merge duration: The histogram of the time spent by TiCDC nodes merging sorted events
- Entry sorter merge duration percentile: The time (P95, P99, and P999) spent by TiCDC merging sorted events within one second
- Mounter unmarshal duration: The histogram of the time spent by TiCDC nodes unmarshaling events
- Mounter unmarshal duration percentile: The time (P95, P99, and P999) spent by TiCDC unmarshaling events within one second
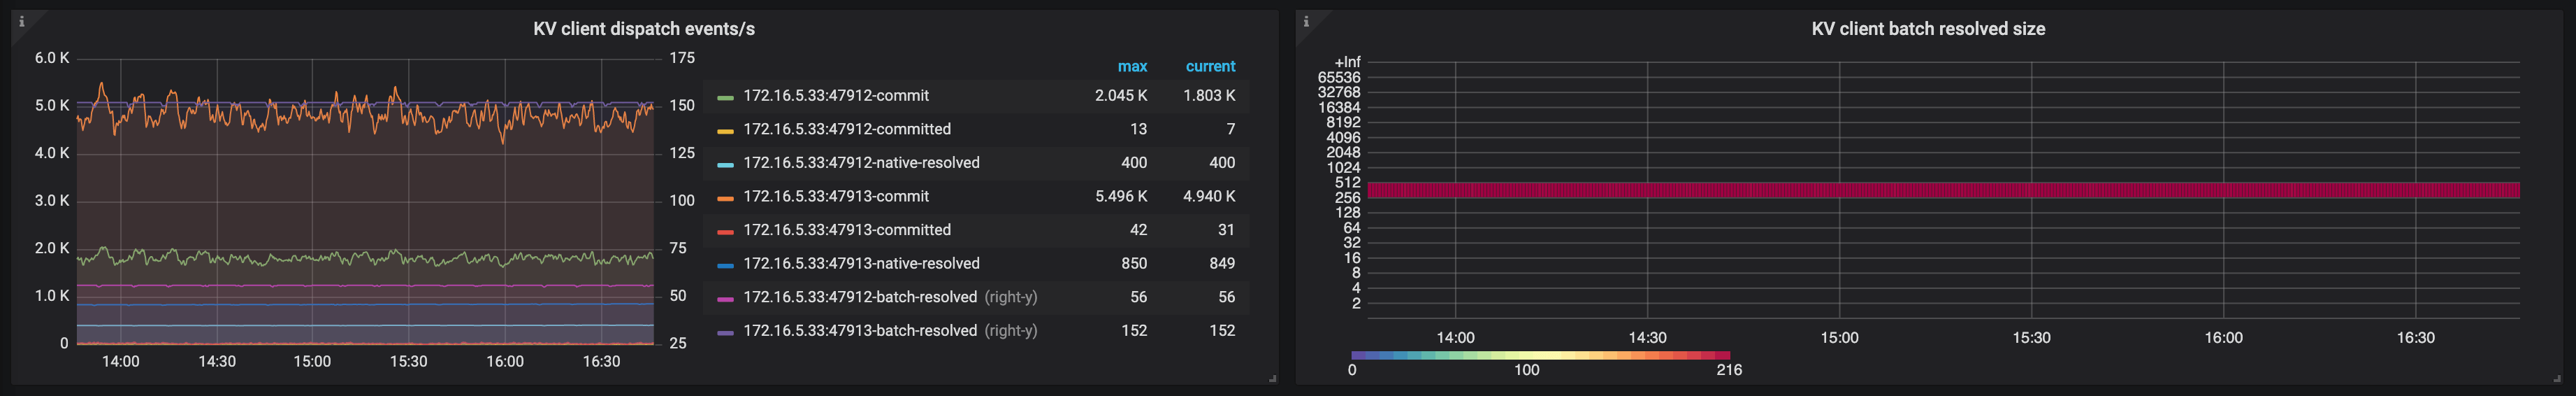
- KV client dispatch events/s: The number of events that the KV client module dispatches among the TiCDC nodes
- KV client batch resolved size: The batch size of resolved timestamp messages that TiKV sends to TiCDC
TiKV
The following is an example of the TiKV panel:
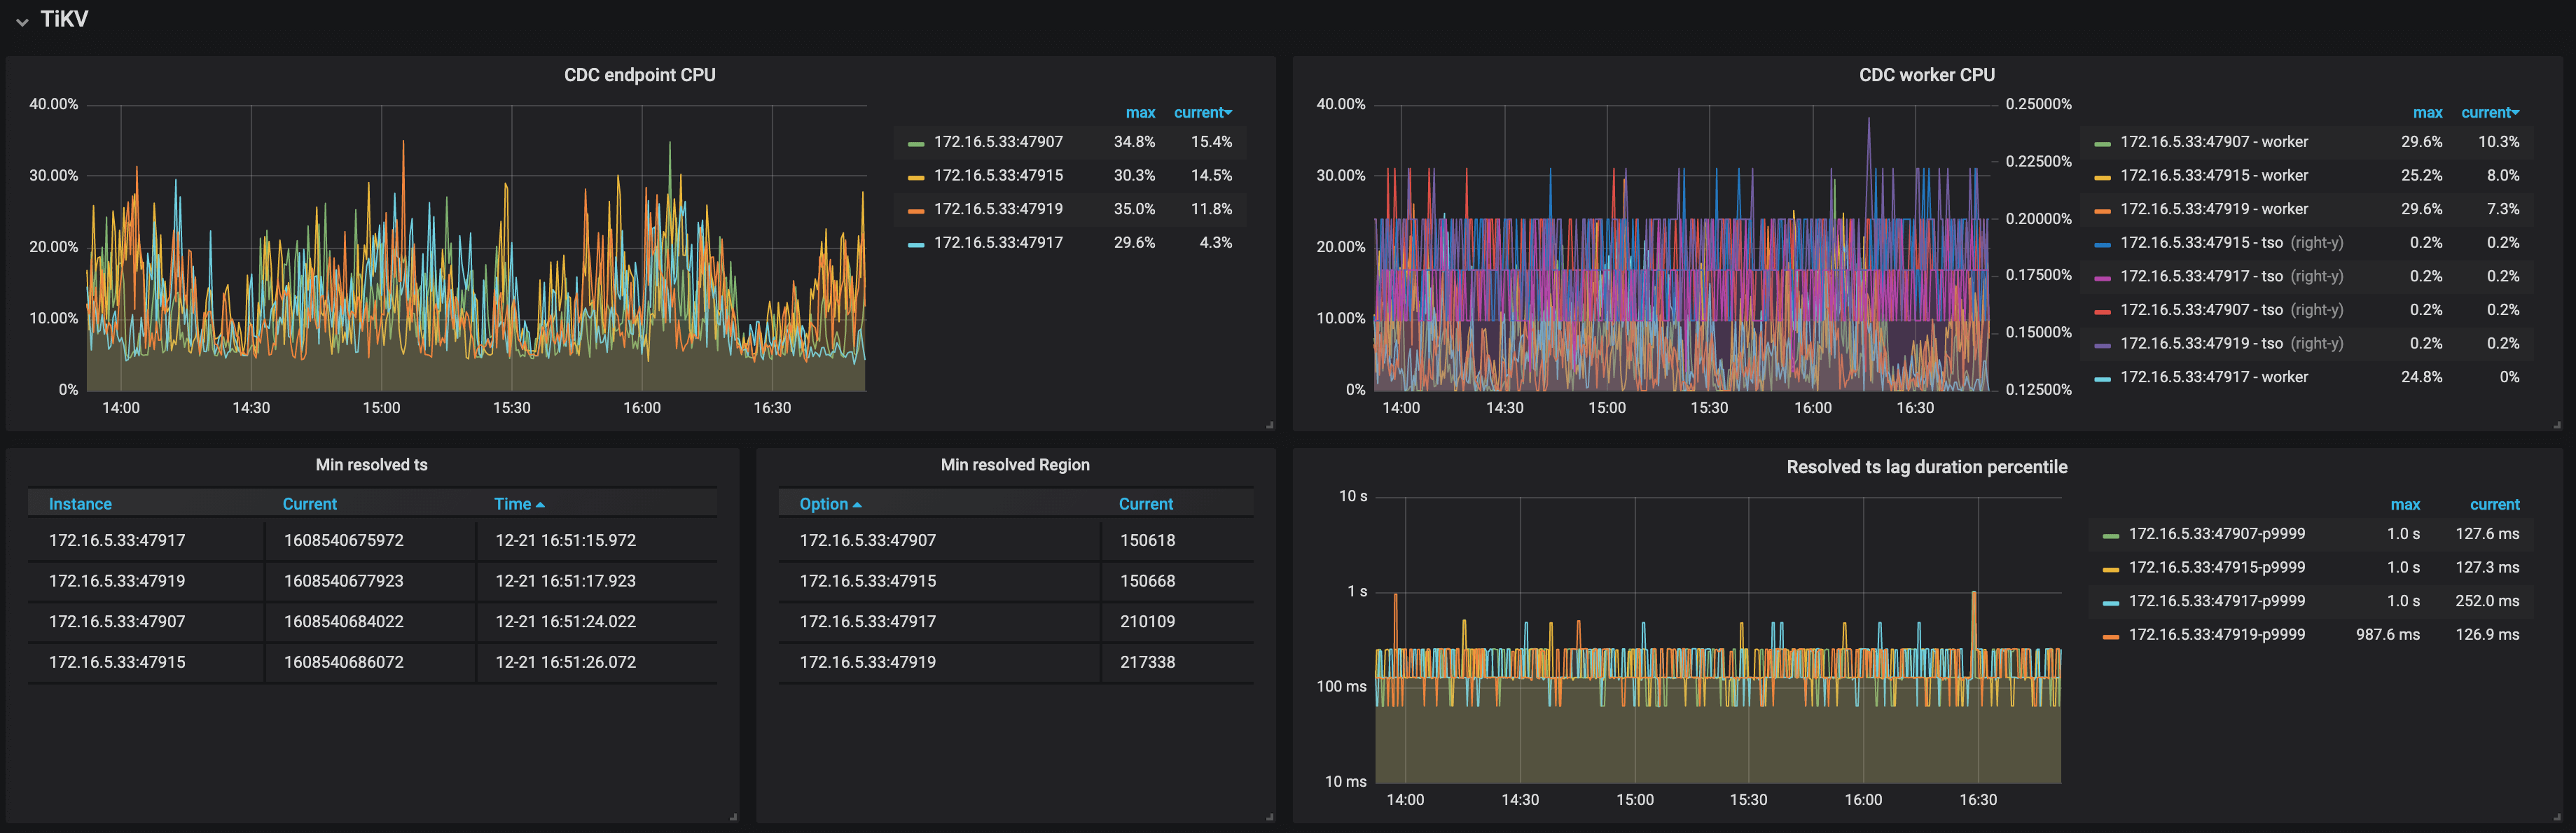
The description of each metric in the TiKV panel is as follows:
- CDC endpoint CPU: The CPU usage of the CDC endpoint threads on TiKV nodes
- CDC worker CPU: The CPU usage of the CDC worker threads on TiKV nodes
- Min resolved ts: The minimum resolved timestamp on TiKV nodes
- Min resolved region: The Region ID of the minimum resolved timestamp on TiKV nodes
- Resolved ts lag duration percentile: The lag between the minimum resolved timestamp on TiKV nodes and the current time
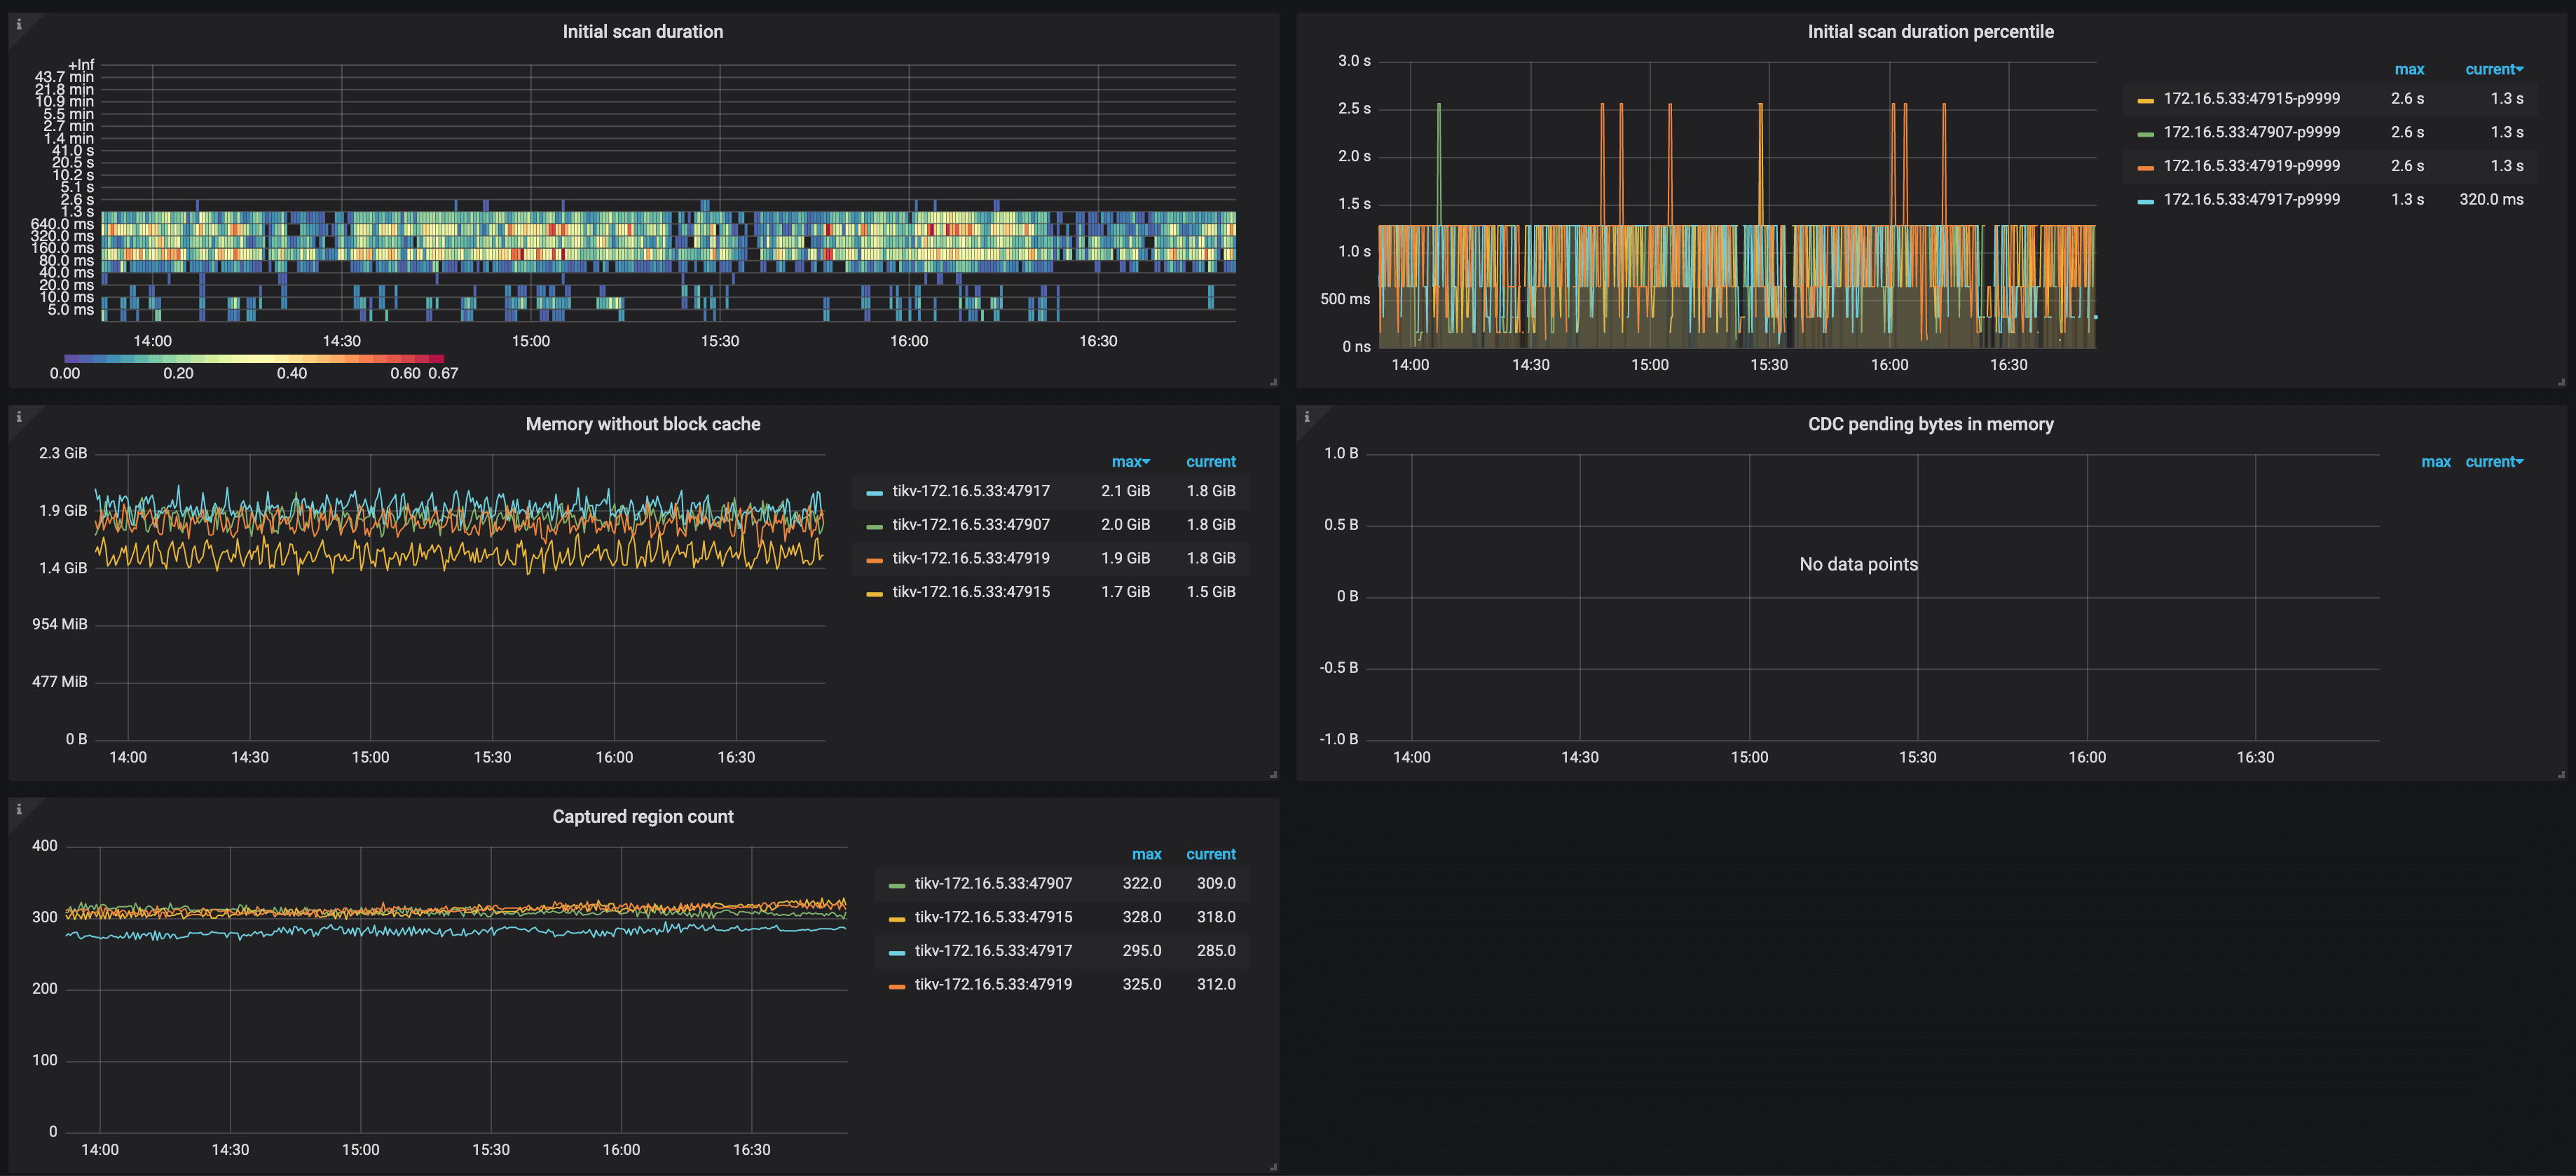
- Initial scan duration: The histogram of the time spent on incremental scan when TiKV nodes connect to TiCDC nodes
- Initial scan duration percentile: The time (P95, P99, and P999) spent on the incremental scan of TiKV nodes within one second
- Memory without block cache: The memory usage of TiKV nodes excluding the RocksDB block cache
- CDC pending bytes in memory: The memory usage of CDC module on TiKV nodes
- Captured region count: The number of event-capturing Regions on TiKV nodes