- Docs Home
- About TiDB
- Quick Start
- Develop
- Overview
- Quick Start
- Build a TiDB Cluster in TiDB Cloud (Developer Tier)
- CRUD SQL in TiDB
- Build a Simple CRUD App with TiDB
- Example Applications
- Connect to TiDB
- Design Database Schema
- Write Data
- Read Data
- Transaction
- Optimize
- Troubleshoot
- Reference
- Cloud Native Development Environment
- Third-party Support
- Deploy
- Software and Hardware Requirements
- Environment Configuration Checklist
- Plan Cluster Topology
- Install and Start
- Verify Cluster Status
- Test Cluster Performance
- Migrate
- Overview
- Migration Tools
- Migration Scenarios
- Migrate from Aurora
- Migrate MySQL of Small Datasets
- Migrate MySQL of Large Datasets
- Migrate and Merge MySQL Shards of Small Datasets
- Migrate and Merge MySQL Shards of Large Datasets
- Migrate from CSV Files
- Migrate from SQL Files
- Migrate from One TiDB Cluster to Another TiDB Cluster
- Migrate from TiDB to MySQL-compatible Databases
- Advanced Migration
- Integrate
- Maintain
- Monitor and Alert
- Troubleshoot
- TiDB Troubleshooting Map
- Identify Slow Queries
- Analyze Slow Queries
- SQL Diagnostics
- Identify Expensive Queries Using Top SQL
- Identify Expensive Queries Using Logs
- Statement Summary Tables
- Troubleshoot Hotspot Issues
- Troubleshoot Increased Read and Write Latency
- Save and Restore the On-Site Information of a Cluster
- Troubleshoot Cluster Setup
- Troubleshoot High Disk I/O Usage
- Troubleshoot Lock Conflicts
- Troubleshoot TiFlash
- Troubleshoot Write Conflicts in Optimistic Transactions
- Troubleshoot Inconsistency Between Data and Indexes
- Performance Tuning
- Tuning Guide
- Configuration Tuning
- System Tuning
- Software Tuning
- SQL Tuning
- Overview
- Understanding the Query Execution Plan
- SQL Optimization Process
- Overview
- Logic Optimization
- Physical Optimization
- Prepare Execution Plan Cache
- Control Execution Plans
- Tutorials
- TiDB Tools
- Overview
- Use Cases
- Download
- TiUP
- Documentation Map
- Overview
- Terminology and Concepts
- Manage TiUP Components
- FAQ
- Troubleshooting Guide
- Command Reference
- Overview
- TiUP Commands
- TiUP Cluster Commands
- Overview
- tiup cluster audit
- tiup cluster check
- tiup cluster clean
- tiup cluster deploy
- tiup cluster destroy
- tiup cluster disable
- tiup cluster display
- tiup cluster edit-config
- tiup cluster enable
- tiup cluster help
- tiup cluster import
- tiup cluster list
- tiup cluster patch
- tiup cluster prune
- tiup cluster reload
- tiup cluster rename
- tiup cluster replay
- tiup cluster restart
- tiup cluster scale-in
- tiup cluster scale-out
- tiup cluster start
- tiup cluster stop
- tiup cluster template
- tiup cluster upgrade
- TiUP DM Commands
- Overview
- tiup dm audit
- tiup dm deploy
- tiup dm destroy
- tiup dm disable
- tiup dm display
- tiup dm edit-config
- tiup dm enable
- tiup dm help
- tiup dm import
- tiup dm list
- tiup dm patch
- tiup dm prune
- tiup dm reload
- tiup dm replay
- tiup dm restart
- tiup dm scale-in
- tiup dm scale-out
- tiup dm start
- tiup dm stop
- tiup dm template
- tiup dm upgrade
- TiDB Cluster Topology Reference
- DM Cluster Topology Reference
- Mirror Reference Guide
- TiUP Components
- PingCAP Clinic Diagnostic Service
- TiDB Operator
- Dumpling
- TiDB Lightning
- TiDB Data Migration
- About TiDB Data Migration
- Architecture
- Quick Start
- Deploy a DM cluster
- Tutorials
- Advanced Tutorials
- Maintain
- Cluster Upgrade
- Tools
- Performance Tuning
- Manage Data Sources
- Manage Tasks
- Export and Import Data Sources and Task Configurations of Clusters
- Handle Alerts
- Daily Check
- Reference
- Architecture
- Command Line
- Configuration Files
- OpenAPI
- Compatibility Catalog
- Secure
- Monitoring and Alerts
- Error Codes
- Glossary
- Example
- Troubleshoot
- Release Notes
- Backup & Restore (BR)
- TiDB Binlog
- TiCDC
- Dumpling
- sync-diff-inspector
- TiSpark
- Reference
- Cluster Architecture
- Key Monitoring Metrics
- Secure
- Privileges
- SQL
- SQL Language Structure and Syntax
- SQL Statements
ADD COLUMNADD INDEXADMINADMIN CANCEL DDLADMIN CHECKSUM TABLEADMIN CHECK [TABLE|INDEX]ADMIN SHOW DDL [JOBS|QUERIES]ADMIN SHOW TELEMETRYALTER DATABASEALTER INDEXALTER INSTANCEALTER PLACEMENT POLICYALTER TABLEALTER TABLE COMPACTALTER USERANALYZE TABLEBACKUPBATCHBEGINCHANGE COLUMNCOMMITCHANGE DRAINERCHANGE PUMPCREATE [GLOBAL|SESSION] BINDINGCREATE DATABASECREATE INDEXCREATE PLACEMENT POLICYCREATE ROLECREATE SEQUENCECREATE TABLE LIKECREATE TABLECREATE USERCREATE VIEWDEALLOCATEDELETEDESCDESCRIBEDODROP [GLOBAL|SESSION] BINDINGDROP COLUMNDROP DATABASEDROP INDEXDROP PLACEMENT POLICYDROP ROLEDROP SEQUENCEDROP STATSDROP TABLEDROP USERDROP VIEWEXECUTEEXPLAIN ANALYZEEXPLAINFLASHBACK TABLEFLUSH PRIVILEGESFLUSH STATUSFLUSH TABLESGRANT <privileges>GRANT <role>INSERTKILL [TIDB]LOAD DATALOAD STATSMODIFY COLUMNPREPARERECOVER TABLERENAME INDEXRENAME TABLEREPLACERESTOREREVOKE <privileges>REVOKE <role>ROLLBACKSELECTSET DEFAULT ROLESET [NAMES|CHARACTER SET]SET PASSWORDSET ROLESET TRANSACTIONSET [GLOBAL|SESSION] <variable>SHOW ANALYZE STATUSSHOW [BACKUPS|RESTORES]SHOW [GLOBAL|SESSION] BINDINGSSHOW BUILTINSSHOW CHARACTER SETSHOW COLLATIONSHOW [FULL] COLUMNS FROMSHOW CONFIGSHOW CREATE PLACEMENT POLICYSHOW CREATE SEQUENCESHOW CREATE TABLESHOW CREATE USERSHOW DATABASESSHOW DRAINER STATUSSHOW ENGINESSHOW ERRORSSHOW [FULL] FIELDS FROMSHOW GRANTSSHOW INDEX [FROM|IN]SHOW INDEXES [FROM|IN]SHOW KEYS [FROM|IN]SHOW MASTER STATUSSHOW PLACEMENTSHOW PLACEMENT FORSHOW PLACEMENT LABELSSHOW PLUGINSSHOW PRIVILEGESSHOW [FULL] PROCESSSLISTSHOW PROFILESSHOW PUMP STATUSSHOW SCHEMASSHOW STATS_HEALTHYSHOW STATS_HISTOGRAMSSHOW STATS_METASHOW STATUSSHOW TABLE NEXT_ROW_IDSHOW TABLE REGIONSSHOW TABLE STATUSSHOW [FULL] TABLESSHOW [GLOBAL|SESSION] VARIABLESSHOW WARNINGSSHUTDOWNSPLIT REGIONSTART TRANSACTIONTABLETRACETRUNCATEUPDATEUSEWITH
- Data Types
- Functions and Operators
- Overview
- Type Conversion in Expression Evaluation
- Operators
- Control Flow Functions
- String Functions
- Numeric Functions and Operators
- Date and Time Functions
- Bit Functions and Operators
- Cast Functions and Operators
- Encryption and Compression Functions
- Locking Functions
- Information Functions
- JSON Functions
- Aggregate (GROUP BY) Functions
- Window Functions
- Miscellaneous Functions
- Precision Math
- Set Operations
- List of Expressions for Pushdown
- TiDB Specific Functions
- Clustered Indexes
- Constraints
- Generated Columns
- SQL Mode
- Table Attributes
- Transactions
- Garbage Collection (GC)
- Views
- Partitioning
- Temporary Tables
- Cached Tables
- Character Set and Collation
- Placement Rules in SQL
- System Tables
mysql- INFORMATION_SCHEMA
- Overview
ANALYZE_STATUSCLIENT_ERRORS_SUMMARY_BY_HOSTCLIENT_ERRORS_SUMMARY_BY_USERCLIENT_ERRORS_SUMMARY_GLOBALCHARACTER_SETSCLUSTER_CONFIGCLUSTER_HARDWARECLUSTER_INFOCLUSTER_LOADCLUSTER_LOGCLUSTER_SYSTEMINFOCOLLATIONSCOLLATION_CHARACTER_SET_APPLICABILITYCOLUMNSDATA_LOCK_WAITSDDL_JOBSDEADLOCKSENGINESINSPECTION_RESULTINSPECTION_RULESINSPECTION_SUMMARYKEY_COLUMN_USAGEMETRICS_SUMMARYMETRICS_TABLESPARTITIONSPLACEMENT_POLICIESPROCESSLISTREFERENTIAL_CONSTRAINTSSCHEMATASEQUENCESSESSION_VARIABLESSLOW_QUERYSTATISTICSTABLESTABLE_CONSTRAINTSTABLE_STORAGE_STATSTIDB_HOT_REGIONSTIDB_HOT_REGIONS_HISTORYTIDB_INDEXESTIDB_SERVERS_INFOTIDB_TRXTIFLASH_REPLICATIKV_REGION_PEERSTIKV_REGION_STATUSTIKV_STORE_STATUSUSER_PRIVILEGESVIEWS
METRICS_SCHEMA
- UI
- TiDB Dashboard
- Overview
- Maintain
- Access
- Overview Page
- Cluster Info Page
- Top SQL Page
- Key Visualizer Page
- Metrics Relation Graph
- SQL Statements Analysis
- Slow Queries Page
- Cluster Diagnostics
- Search Logs Page
- Instance Profiling
- Session Management and Configuration
- FAQ
- CLI
- Command Line Flags
- Configuration File Parameters
- System Variables
- Storage Engines
- Telemetry
- Errors Codes
- Table Filter
- Schedule Replicas by Topology Labels
- FAQs
- Release Notes
- All Releases
- Release Timeline
- TiDB Versioning
- v6.1
- v6.0
- v5.4
- v5.3
- v5.2
- v5.1
- v5.0
- v4.0
- v3.1
- v3.0
- v2.1
- v2.0
- v1.0
- Glossary
Key Visualizer Page
The Key Visualizer page of TiDB Dashboard is used to analyze the usage of TiDB and troubleshoot traffic hotspots. This page visually shows the traffic of the TiDB cluster over a period of time.
Access Key Visualizer page
You can use one of the following two methods to access the Key Visualizer page:
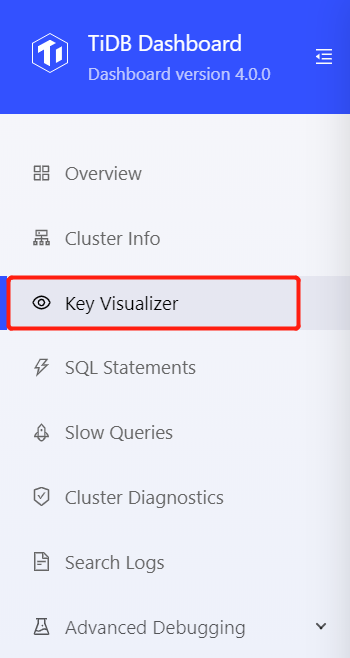
- After logging into TiDB Dashboard, click Key Visualizer on the left navigation menu:
- Visit http://127.0.0.1:2379/dashboard/#/keyviz in your browser. Replace
127.0.0.1:2379with the actual PD instance address and port.
Interface demonstration
The following image is a demonstration of the Key Visualizer page:
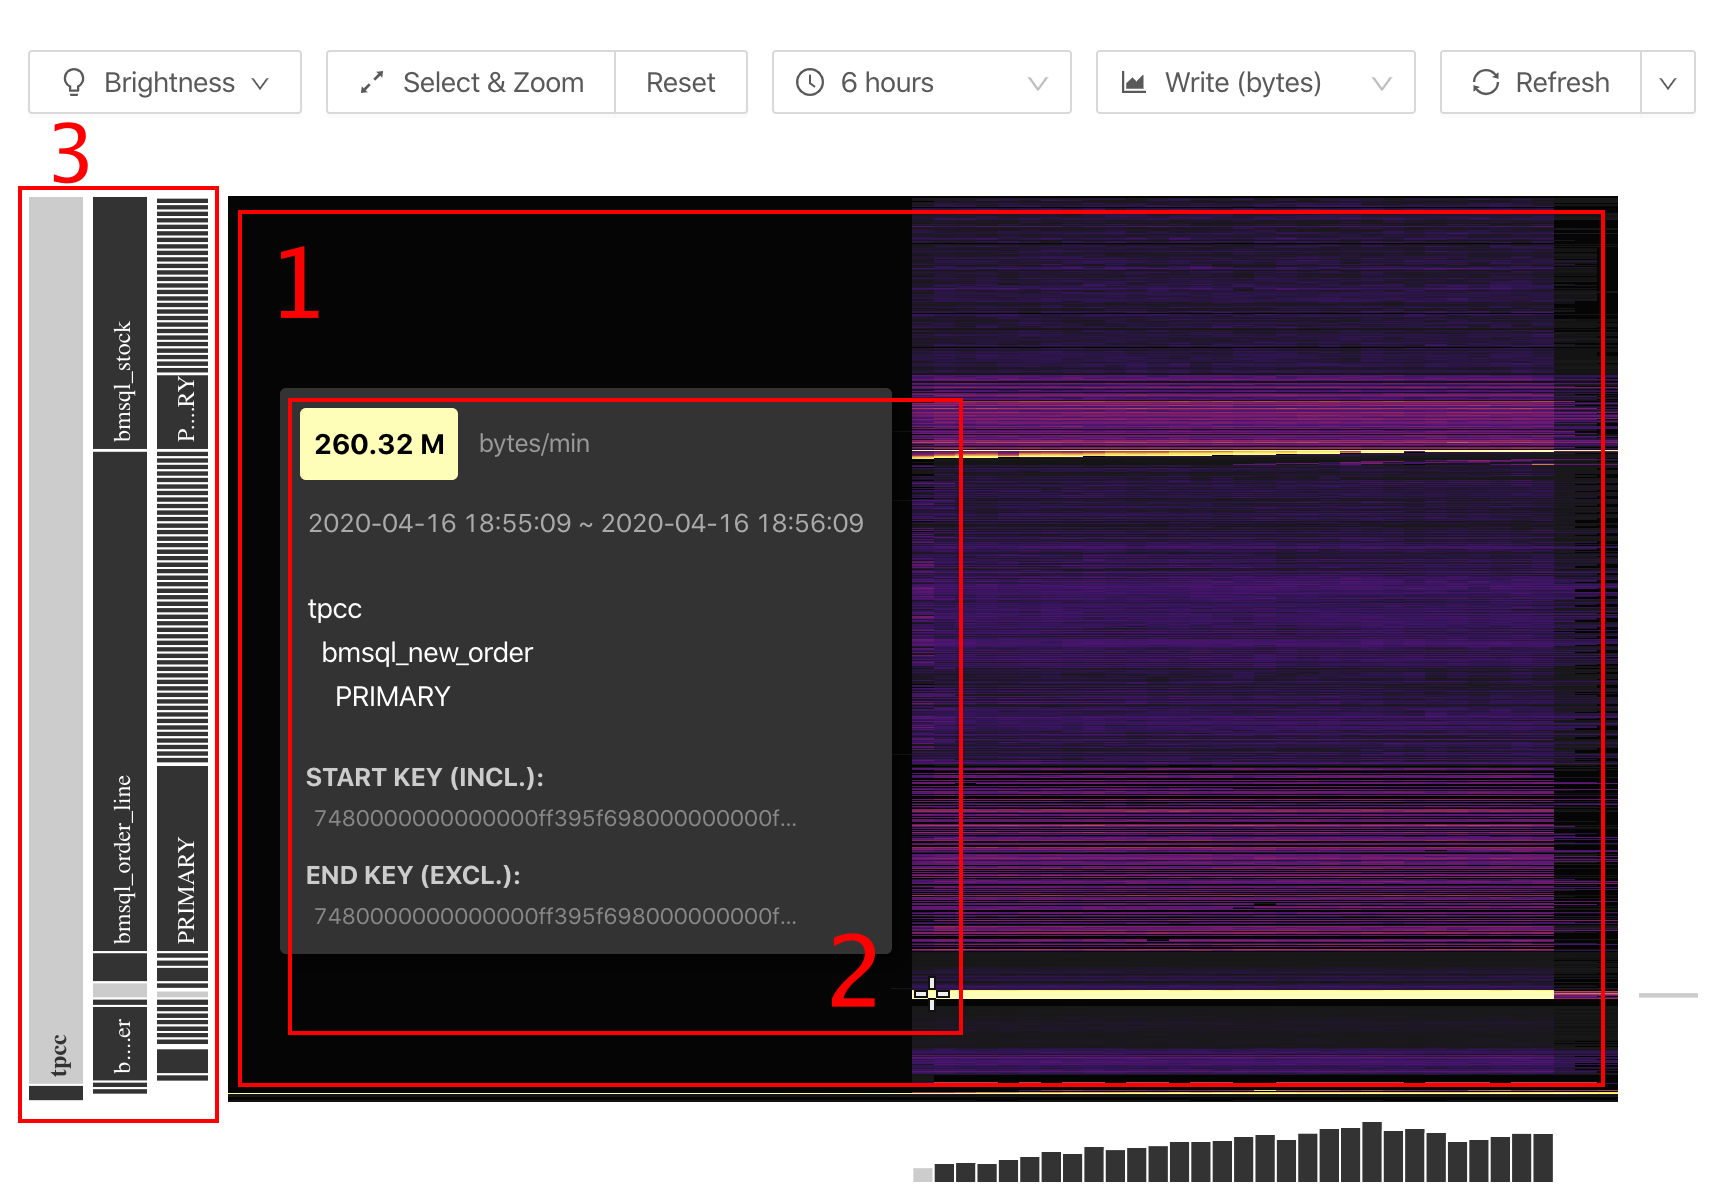
From the interface above, you can see the following objects:
- A large heatmap that shows changes of the overall traffic over time.
- The detailed information of a certain coordinate point.
- Information of tables, indexes, and so on (on the left side of the heatmap).
Basic concepts
This section introduces the basic concepts that relate to Key Visualizer.
Region
In a TiDB cluster, the stored data is distributed among TiKV instances. Logically, TiKV is a huge and orderly key-value map. The whole key-value space is divided into many segments and each segment consists of a series of adjacent keys. Such segment is called a Region.
For detailed introduction of Region, refer to TiDB Internal (I) - Data Storage.
Hotspot
When you use the TiDB database, the hotspot issue is typical, where high traffic is concentrated on a small range of data. Because consecutive data ranges are often processed on the same TiKV instance, the TiKV instance on which the hotspot occurs becomes the performance bottleneck of the whole application. The hotspot issue often occurs in the following scenarios:
- Write adjacent data into a table with the
AUTO_INCREMENTprimary key, which causes a hotspot issue on this table. - Write adjacent time data into the time index of a table, which causes a hotspot issue on the table index.
For more details about hotspot, refer to Highly Concurrent Write Best Practices
Heatmap
The heatmap is the core part of Key Visualizer, which shows the change of a metric over time. The X-axis of the heatmap indicates the time. The Y-axis of the heatmap indicates the consecutive Regions based on key ranges that cover all schemas and tables of the TiDB cluster.
Colder colors in the heatmap indicate lower read and write traffic of Regions in that period of time. Hotter (brighter) colors indicate higher traffic.
Region compression
A TiDB cluster might have up to hundreds of thousands of Regions. It is difficult to display so many Regions on screen. Therefore, on each heatmap, these Regions are compressed into 1,500 consecutive ranges, each range called a Bucket. In the heatmap, because hotter instances need more attention, Key Visualizer tends to compress a large number of Regions with lower traffic into one Bucket, and displays the Region with higher traffic also in one Bucket.
Use Key Visualizer
This section introduces how to use Key Visualizer.
Settings
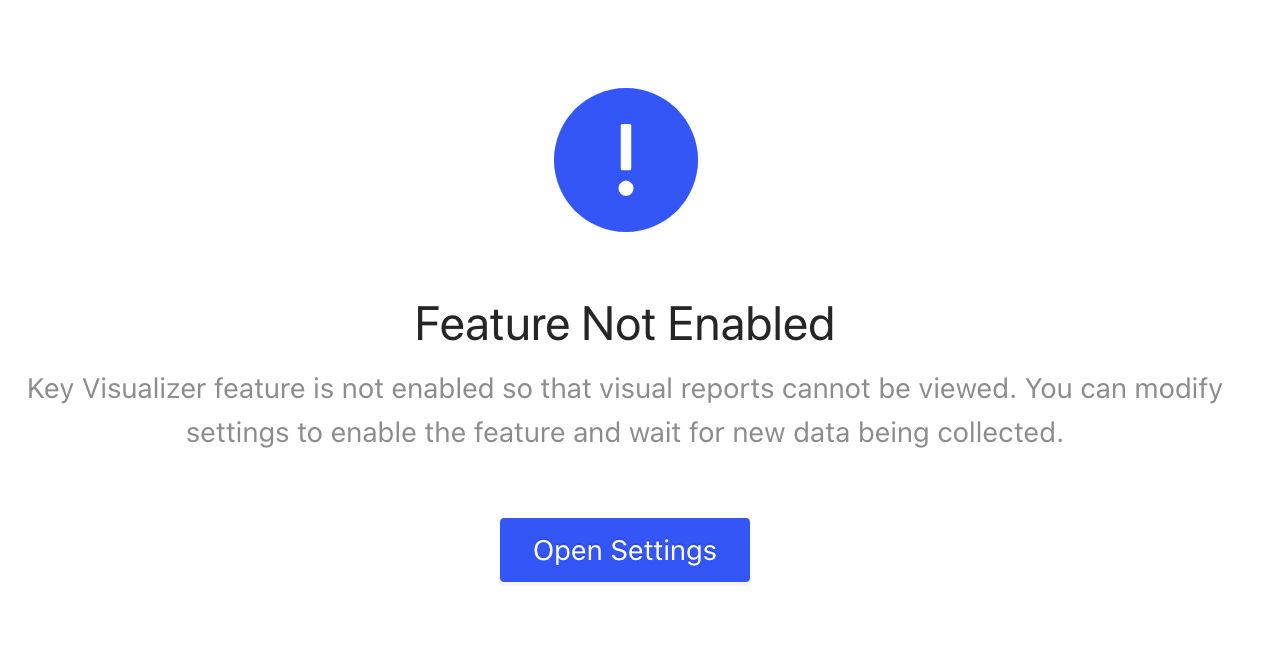
To use the Key Visualizer page for the first time, you need to manually enable this feature on the Settings page. Follow the page guide and click Open Settings to open the settings page:
After this feature is enabled, you can open the settings page by clicking the Settings icon in the upper right corner:

The settings page is shown as follows:
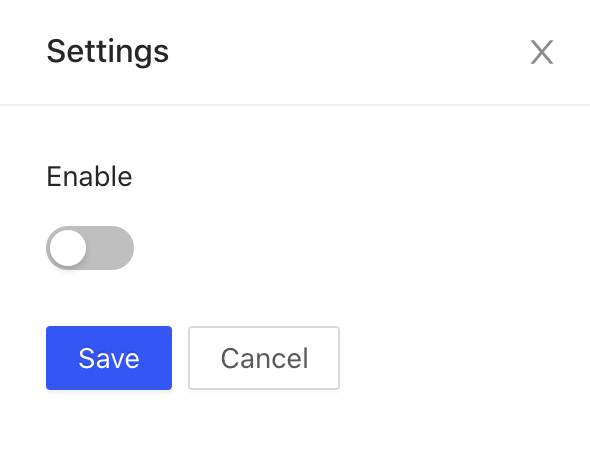
Set whether to start data collection through the switch, and click Save to take effect. After enabling the feature, you can see that the toolbar is available:

After this feature is enabled, data collection is going on at the backend. You can see the heatmap shortly.
Observe a certain period of time or Region range
When you open Key Visualizer, the heatmap of the entire database over the recent six hours is displayed by default. In this heatmap, the closer to the right side (current time), the shorter the time interval corresponding to each column of Buckets. If you want to observe a specific time period or a specific Region range, you can zoom in to get more details. The specific instructions are as follows:
Scroll up or down in the heatmap.
Click and drag one of the following buttons to select the range.
- Click the Select & Zoom button. Then click and drag this button to select the area to zoom in.
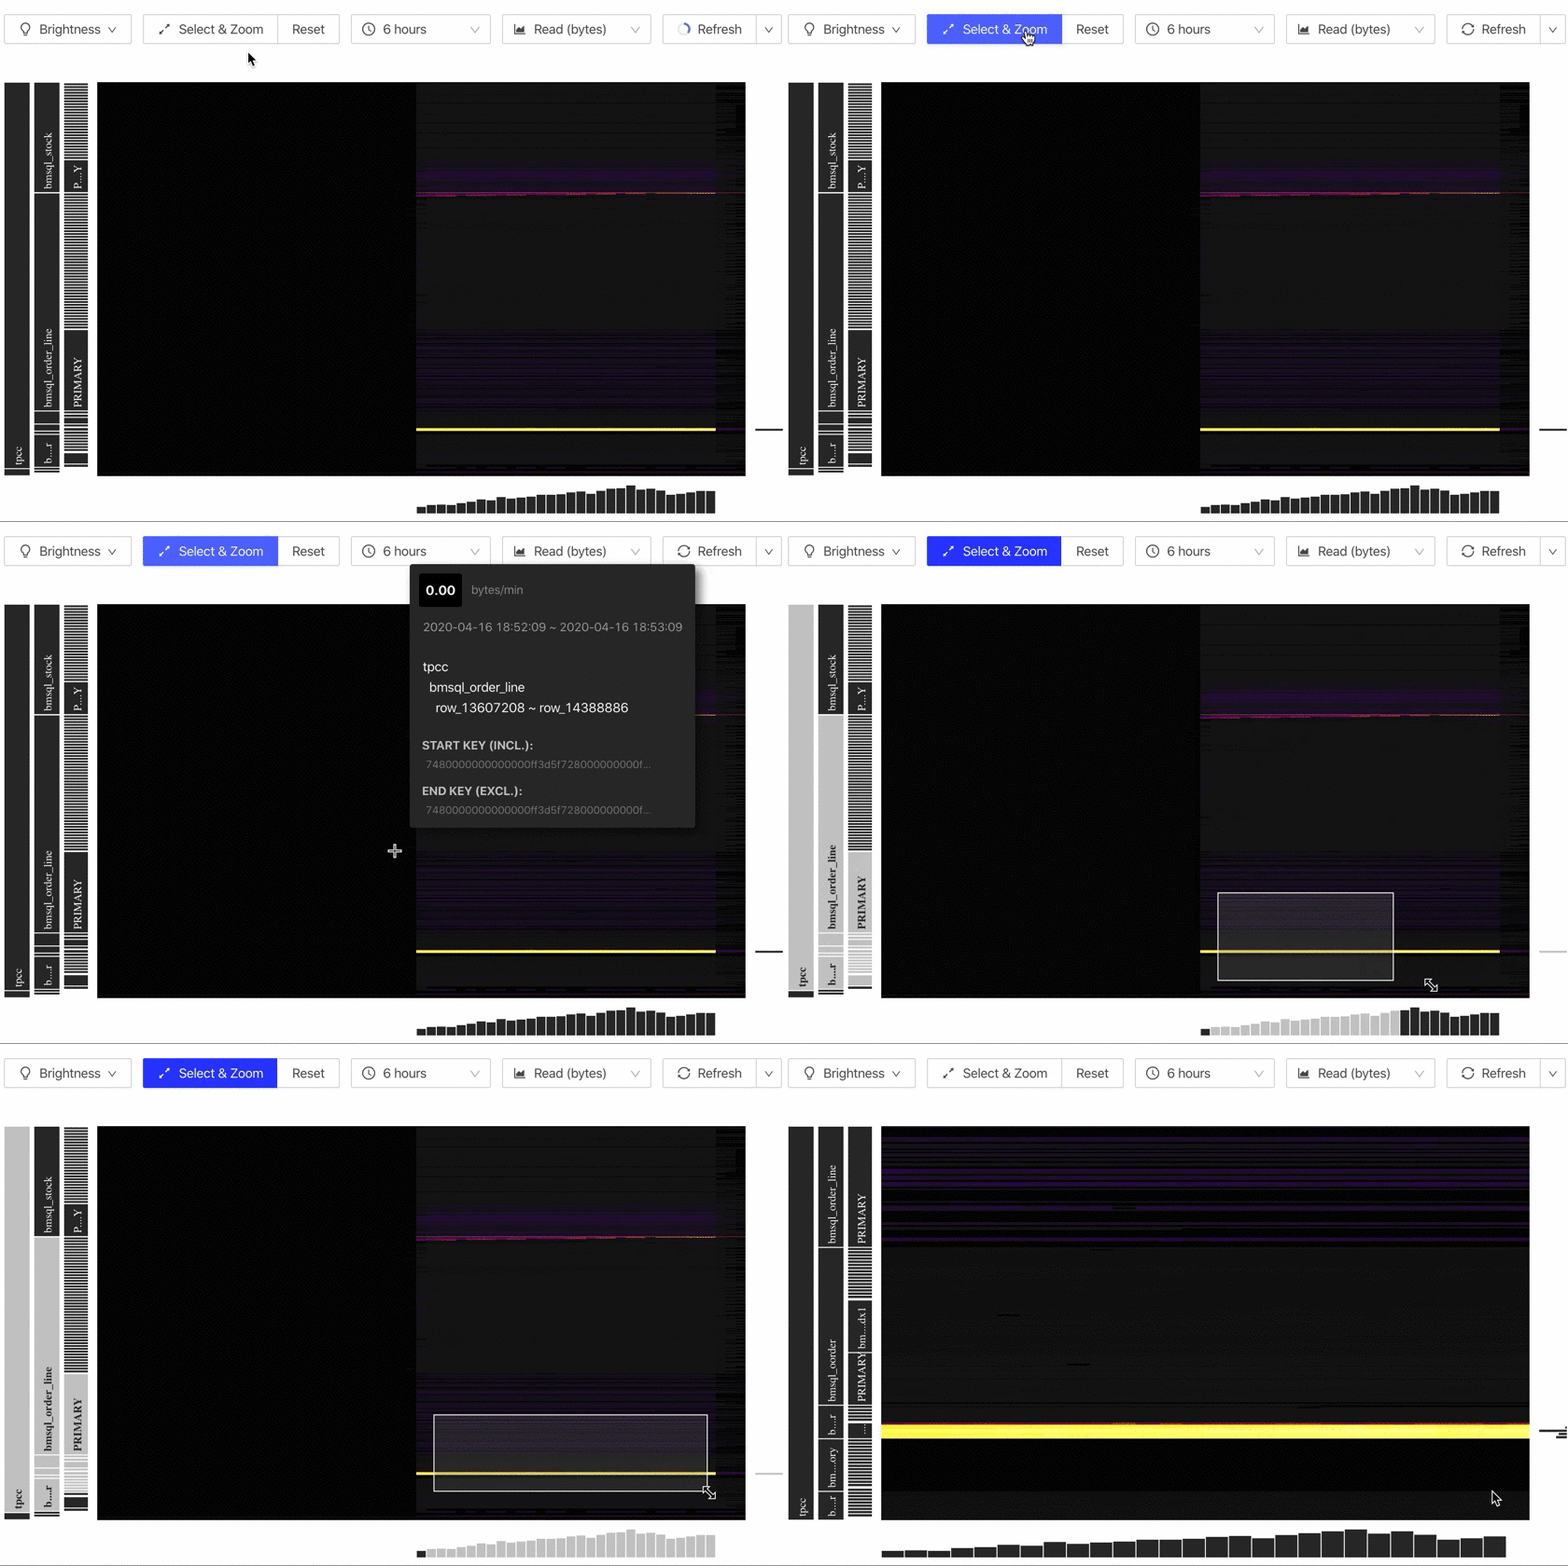
- Click the Reset button to reset the Region range to the entire database.
- Click the time selection box (at the position of
6 hourson the interface above) and select the observation time period again.
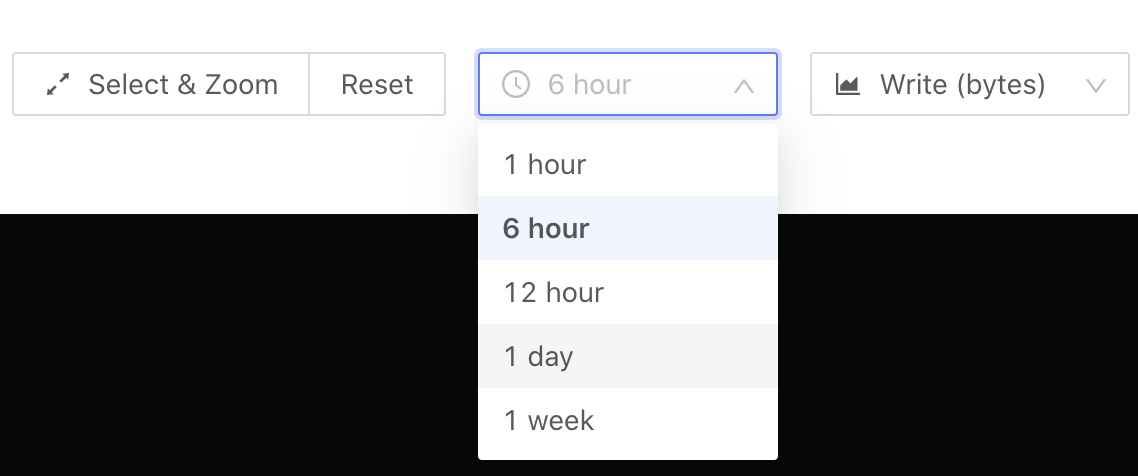
If you follow step 2 in the instruction above, the heatmap is redrawn, which might be very different from the original heatmap. This difference is normal because if you observe in more detail, the granularity of the Region compression has changed, or the basis of hot in a specific range has changed.
Adjust brightness
The heatmap uses colors of different brightnesses to indicate the Bucket traffic. Colder colors in the heatmap indicate lower read and write traffic of the Region in that period of time. Hotter (brighter) colors indicate higher traffic. If the color is too cold or too hot, it is difficult to observe in details. In this situation, you can click the Brightness button and then use the slider to adjust the brightness of the page.
When Key Visualizer displays the heatmap of an area, it defines the basis of being cold and hot according to the traffic of this area. When the traffic in the entire area is relatively even, even if the overall traffic is low in value, you might still see a large bright-colored area. Remember to include the value into your analysis.
Select metrics
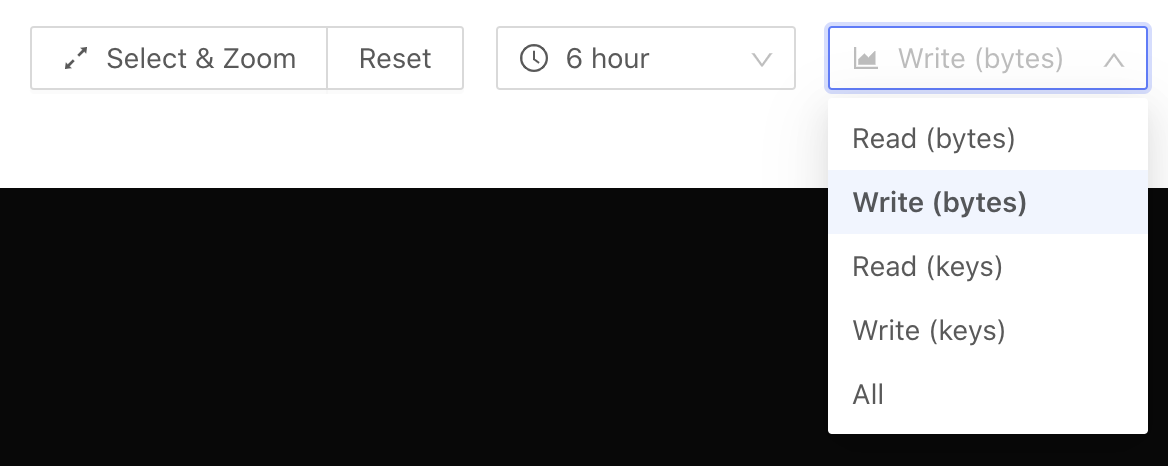
You can view a metric you are interested in by selecting this metric in the metrics selection box (at the Write (bytes) position in the interface above):
Read (bytes): Read traffic.Write (bytes): Write traffic.Read (keys): The number of read rows.Write (keys): The number of written rows.All: The sum of read and write traffic.
Refresh and automatic refresh
To regain a heatmap based on the current time, click the Refresh button. If you need to observe the traffic distribution of the database in real time, click the down arrow on the right side of the Refresh button and select a fixed time interval for the heatmap to automatically refresh at this interval.
If you adjust the time range or Region range, the automatic refresh is disabled.
See Bucket details
You can hover your mouse over the Bucket you are interested in to view the detailed information of this Region range. The image below is an example of this information:
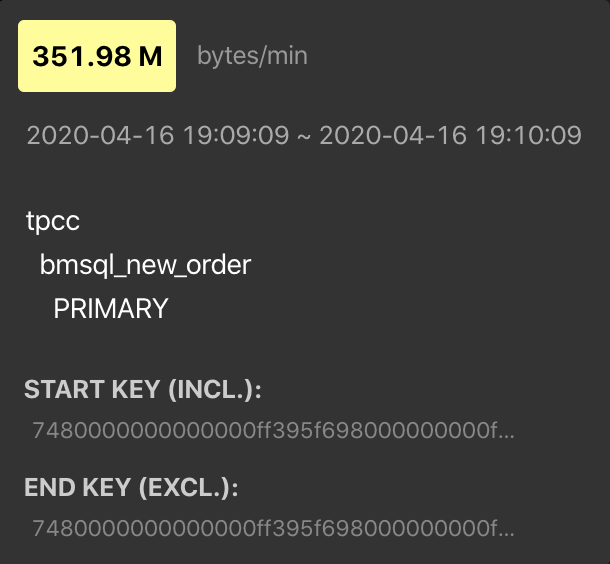
If you want to copy this information, click a Bucket. Then, the page with relevant details is temporarily pinned. Click on the information, and you have copied it to the clipboard.
Common heatmap types
This section shows and interprets four common types of heatmap in Key Visualizer.
Evenly distributed workload
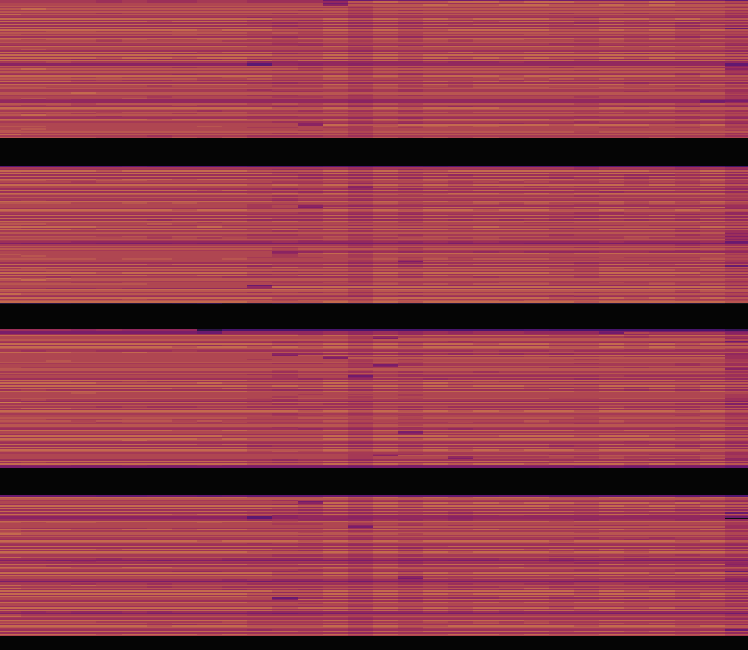
In the heatmap above, bright and dark colors are a fine-grained mix. This indicates that reads or writes are evenly distributed over time and among key ranges. The workload is evenly distributed to all nodes, which is ideal for a distributed database.
Periodically reads and writes
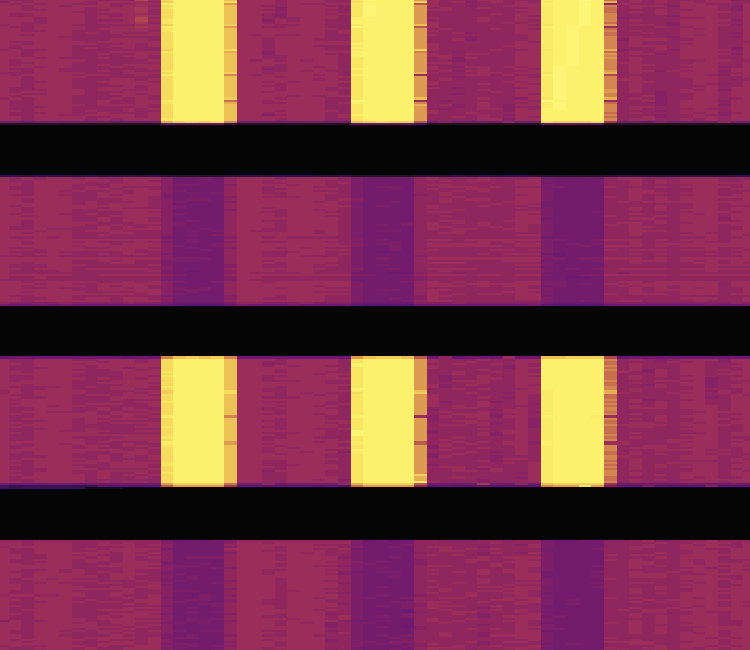
In the heatmap above, there is an alternating brightness and darkness along the X-axis (time) but the brightness is relatively even along the Y-axis (Region). This indicates that the reads and writes change periodically, which might occur in scenarios of periodically scheduled tasks. For example, the big data platform periodically extracts data from TiDB every day. In this kind of scenarios, pay attention to whether the resources are sufficient during peak usage.
Concentrated reads or writes
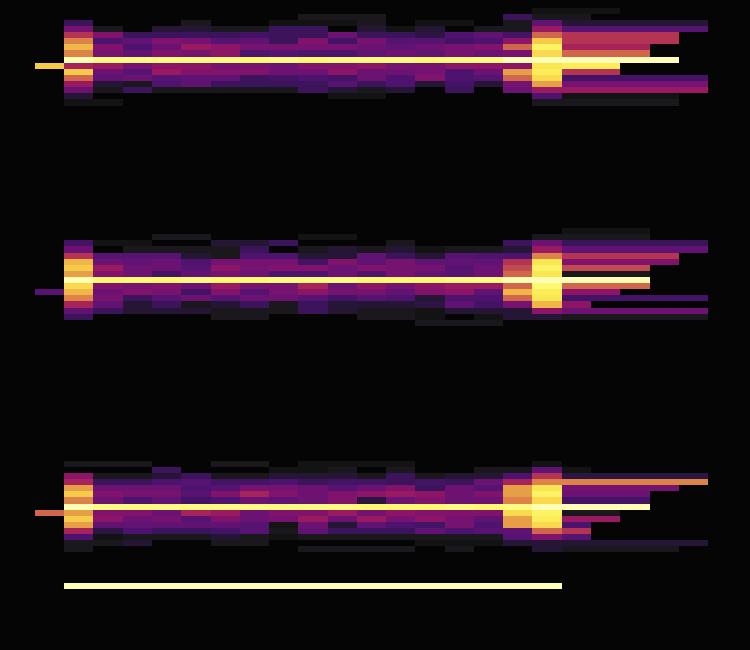
In the heatmap above, you can see several bright lines. Along the Y-axis, the fringes around the bright lines are dark, which indicates that the Regions corresponding to bright lines have high read and write traffic. You can observe whether the traffic distribution is expected by your application. For example, when all services are associated with the user table, the overall traffic of the user table can be high, so it is reasonable to show bright lines in the heatmap.
In addition, the height of the bright lines (the thickness along the Y-axis) is important. Because TiKV has its own Region-based hotspot balancing mechanism, the more Regions involved in the hotspot, the better it is for balancing traffic across all TiKV instances. The thicker and more bright lines indicate that hotspots are more scattered, and TiKV is better used. The thinner and fewer bright lines indicate that hotspots are more concentrated, and the hotspot issue is more obvious in TiKV, which might requires manual intervention.
Sequential reads or writes
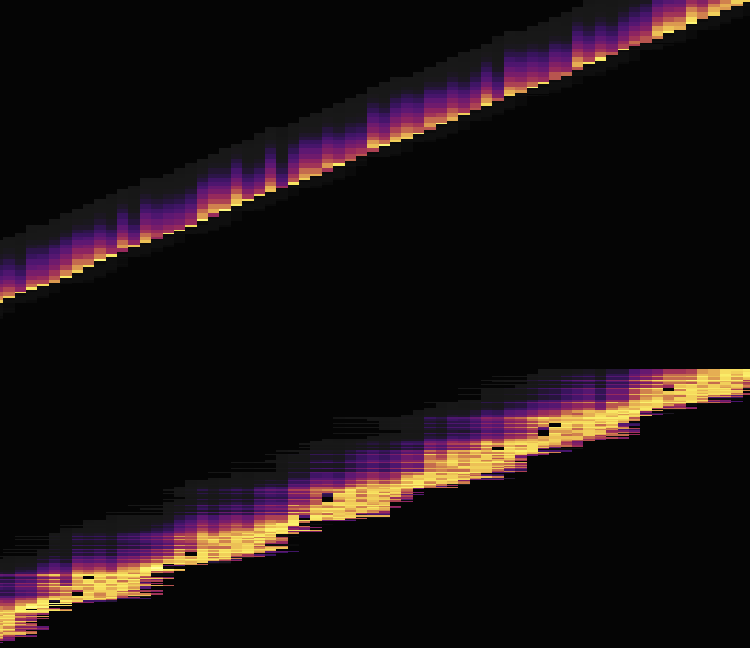
In the heatmap above, you can see a bright line. This means that the data reads or writes are sequential. Typical scenarios of sequential data reads or writes are importing data or scanning tables and indexes. For example, you continuously write data to tables with auto-increment IDs.
Regions in the bright areas are the hotspots of read and write traffic, which often become the performance bottleneck of the entire cluster. In this situation, you might need to readjust the primary key for the application. By doing this, you scatter Regions much as possible to spread the pressure across multiple Regions. You can also schedule application tasks during the low-peak period.
In this section, only the common types of heatmap are shown. Key Visualizer actually displays the heatmap of all schemas and tables in the entire cluster, so you might see different types of heatmap in different areas, or mixed results of multiple heatmap types. Use the heatmap based on the actual situation.
Address hotspot issues
TiDB has some built-in features to mitigate the common hotspot issue. Refer to Highly Concurrent Write Best Practices for details.