- Docs Home
- About TiDB
- Quick Start
- Develop
- Overview
- Quick Start
- Build a TiDB Cluster in TiDB Cloud (Developer Tier)
- CRUD SQL in TiDB
- Build a Simple CRUD App with TiDB
- Example Applications
- Connect to TiDB
- Design Database Schema
- Write Data
- Read Data
- Transaction
- Optimize
- Troubleshoot
- Reference
- Cloud Native Development Environment
- Third-party Support
- Deploy
- Software and Hardware Requirements
- Environment Configuration Checklist
- Plan Cluster Topology
- Install and Start
- Verify Cluster Status
- Test Cluster Performance
- Migrate
- Overview
- Migration Tools
- Migration Scenarios
- Migrate from Aurora
- Migrate MySQL of Small Datasets
- Migrate MySQL of Large Datasets
- Migrate and Merge MySQL Shards of Small Datasets
- Migrate and Merge MySQL Shards of Large Datasets
- Migrate from CSV Files
- Migrate from SQL Files
- Migrate from One TiDB Cluster to Another TiDB Cluster
- Migrate from TiDB to MySQL-compatible Databases
- Advanced Migration
- Integrate
- Maintain
- Monitor and Alert
- Troubleshoot
- TiDB Troubleshooting Map
- Identify Slow Queries
- Analyze Slow Queries
- SQL Diagnostics
- Identify Expensive Queries Using Top SQL
- Identify Expensive Queries Using Logs
- Statement Summary Tables
- Troubleshoot Hotspot Issues
- Troubleshoot Increased Read and Write Latency
- Save and Restore the On-Site Information of a Cluster
- Troubleshoot Cluster Setup
- Troubleshoot High Disk I/O Usage
- Troubleshoot Lock Conflicts
- Troubleshoot TiFlash
- Troubleshoot Write Conflicts in Optimistic Transactions
- Troubleshoot Inconsistency Between Data and Indexes
- Performance Tuning
- Tuning Guide
- Configuration Tuning
- System Tuning
- Software Tuning
- SQL Tuning
- Overview
- Understanding the Query Execution Plan
- SQL Optimization Process
- Overview
- Logic Optimization
- Physical Optimization
- Prepare Execution Plan Cache
- Control Execution Plans
- Tutorials
- TiDB Tools
- Overview
- Use Cases
- Download
- TiUP
- Documentation Map
- Overview
- Terminology and Concepts
- Manage TiUP Components
- FAQ
- Troubleshooting Guide
- Command Reference
- Overview
- TiUP Commands
- TiUP Cluster Commands
- Overview
- tiup cluster audit
- tiup cluster check
- tiup cluster clean
- tiup cluster deploy
- tiup cluster destroy
- tiup cluster disable
- tiup cluster display
- tiup cluster edit-config
- tiup cluster enable
- tiup cluster help
- tiup cluster import
- tiup cluster list
- tiup cluster patch
- tiup cluster prune
- tiup cluster reload
- tiup cluster rename
- tiup cluster replay
- tiup cluster restart
- tiup cluster scale-in
- tiup cluster scale-out
- tiup cluster start
- tiup cluster stop
- tiup cluster template
- tiup cluster upgrade
- TiUP DM Commands
- Overview
- tiup dm audit
- tiup dm deploy
- tiup dm destroy
- tiup dm disable
- tiup dm display
- tiup dm edit-config
- tiup dm enable
- tiup dm help
- tiup dm import
- tiup dm list
- tiup dm patch
- tiup dm prune
- tiup dm reload
- tiup dm replay
- tiup dm restart
- tiup dm scale-in
- tiup dm scale-out
- tiup dm start
- tiup dm stop
- tiup dm template
- tiup dm upgrade
- TiDB Cluster Topology Reference
- DM Cluster Topology Reference
- Mirror Reference Guide
- TiUP Components
- PingCAP Clinic Diagnostic Service
- TiDB Operator
- Dumpling
- TiDB Lightning
- TiDB Data Migration
- About TiDB Data Migration
- Architecture
- Quick Start
- Deploy a DM cluster
- Tutorials
- Advanced Tutorials
- Maintain
- Cluster Upgrade
- Tools
- Performance Tuning
- Manage Data Sources
- Manage Tasks
- Export and Import Data Sources and Task Configurations of Clusters
- Handle Alerts
- Daily Check
- Reference
- Architecture
- Command Line
- Configuration Files
- OpenAPI
- Compatibility Catalog
- Secure
- Monitoring and Alerts
- Error Codes
- Glossary
- Example
- Troubleshoot
- Release Notes
- Backup & Restore (BR)
- TiDB Binlog
- TiCDC
- Dumpling
- sync-diff-inspector
- TiSpark
- Reference
- Cluster Architecture
- Key Monitoring Metrics
- Secure
- Privileges
- SQL
- SQL Language Structure and Syntax
- SQL Statements
ADD COLUMNADD INDEXADMINADMIN CANCEL DDLADMIN CHECKSUM TABLEADMIN CHECK [TABLE|INDEX]ADMIN SHOW DDL [JOBS|QUERIES]ADMIN SHOW TELEMETRYALTER DATABASEALTER INDEXALTER INSTANCEALTER PLACEMENT POLICYALTER TABLEALTER TABLE COMPACTALTER USERANALYZE TABLEBACKUPBATCHBEGINCHANGE COLUMNCOMMITCHANGE DRAINERCHANGE PUMPCREATE [GLOBAL|SESSION] BINDINGCREATE DATABASECREATE INDEXCREATE PLACEMENT POLICYCREATE ROLECREATE SEQUENCECREATE TABLE LIKECREATE TABLECREATE USERCREATE VIEWDEALLOCATEDELETEDESCDESCRIBEDODROP [GLOBAL|SESSION] BINDINGDROP COLUMNDROP DATABASEDROP INDEXDROP PLACEMENT POLICYDROP ROLEDROP SEQUENCEDROP STATSDROP TABLEDROP USERDROP VIEWEXECUTEEXPLAIN ANALYZEEXPLAINFLASHBACK TABLEFLUSH PRIVILEGESFLUSH STATUSFLUSH TABLESGRANT <privileges>GRANT <role>INSERTKILL [TIDB]LOAD DATALOAD STATSMODIFY COLUMNPREPARERECOVER TABLERENAME INDEXRENAME TABLEREPLACERESTOREREVOKE <privileges>REVOKE <role>ROLLBACKSELECTSET DEFAULT ROLESET [NAMES|CHARACTER SET]SET PASSWORDSET ROLESET TRANSACTIONSET [GLOBAL|SESSION] <variable>SHOW ANALYZE STATUSSHOW [BACKUPS|RESTORES]SHOW [GLOBAL|SESSION] BINDINGSSHOW BUILTINSSHOW CHARACTER SETSHOW COLLATIONSHOW [FULL] COLUMNS FROMSHOW CONFIGSHOW CREATE PLACEMENT POLICYSHOW CREATE SEQUENCESHOW CREATE TABLESHOW CREATE USERSHOW DATABASESSHOW DRAINER STATUSSHOW ENGINESSHOW ERRORSSHOW [FULL] FIELDS FROMSHOW GRANTSSHOW INDEX [FROM|IN]SHOW INDEXES [FROM|IN]SHOW KEYS [FROM|IN]SHOW MASTER STATUSSHOW PLACEMENTSHOW PLACEMENT FORSHOW PLACEMENT LABELSSHOW PLUGINSSHOW PRIVILEGESSHOW [FULL] PROCESSSLISTSHOW PROFILESSHOW PUMP STATUSSHOW SCHEMASSHOW STATS_HEALTHYSHOW STATS_HISTOGRAMSSHOW STATS_METASHOW STATUSSHOW TABLE NEXT_ROW_IDSHOW TABLE REGIONSSHOW TABLE STATUSSHOW [FULL] TABLESSHOW [GLOBAL|SESSION] VARIABLESSHOW WARNINGSSHUTDOWNSPLIT REGIONSTART TRANSACTIONTABLETRACETRUNCATEUPDATEUSEWITH
- Data Types
- Functions and Operators
- Overview
- Type Conversion in Expression Evaluation
- Operators
- Control Flow Functions
- String Functions
- Numeric Functions and Operators
- Date and Time Functions
- Bit Functions and Operators
- Cast Functions and Operators
- Encryption and Compression Functions
- Locking Functions
- Information Functions
- JSON Functions
- Aggregate (GROUP BY) Functions
- Window Functions
- Miscellaneous Functions
- Precision Math
- Set Operations
- List of Expressions for Pushdown
- TiDB Specific Functions
- Clustered Indexes
- Constraints
- Generated Columns
- SQL Mode
- Table Attributes
- Transactions
- Garbage Collection (GC)
- Views
- Partitioning
- Temporary Tables
- Cached Tables
- Character Set and Collation
- Placement Rules in SQL
- System Tables
mysql- INFORMATION_SCHEMA
- Overview
ANALYZE_STATUSCLIENT_ERRORS_SUMMARY_BY_HOSTCLIENT_ERRORS_SUMMARY_BY_USERCLIENT_ERRORS_SUMMARY_GLOBALCHARACTER_SETSCLUSTER_CONFIGCLUSTER_HARDWARECLUSTER_INFOCLUSTER_LOADCLUSTER_LOGCLUSTER_SYSTEMINFOCOLLATIONSCOLLATION_CHARACTER_SET_APPLICABILITYCOLUMNSDATA_LOCK_WAITSDDL_JOBSDEADLOCKSENGINESINSPECTION_RESULTINSPECTION_RULESINSPECTION_SUMMARYKEY_COLUMN_USAGEMETRICS_SUMMARYMETRICS_TABLESPARTITIONSPLACEMENT_POLICIESPROCESSLISTREFERENTIAL_CONSTRAINTSSCHEMATASEQUENCESSESSION_VARIABLESSLOW_QUERYSTATISTICSTABLESTABLE_CONSTRAINTSTABLE_STORAGE_STATSTIDB_HOT_REGIONSTIDB_HOT_REGIONS_HISTORYTIDB_INDEXESTIDB_SERVERS_INFOTIDB_TRXTIFLASH_REPLICATIKV_REGION_PEERSTIKV_REGION_STATUSTIKV_STORE_STATUSUSER_PRIVILEGESVIEWS
METRICS_SCHEMA
- UI
- TiDB Dashboard
- Overview
- Maintain
- Access
- Overview Page
- Cluster Info Page
- Top SQL Page
- Key Visualizer Page
- Metrics Relation Graph
- SQL Statements Analysis
- Slow Queries Page
- Cluster Diagnostics
- Search Logs Page
- Instance Profiling
- Session Management and Configuration
- FAQ
- CLI
- Command Line Flags
- Configuration File Parameters
- System Variables
- Storage Engines
- Telemetry
- Errors Codes
- Table Filter
- Schedule Replicas by Topology Labels
- FAQs
- Release Notes
- All Releases
- Release Timeline
- TiDB Versioning
- v6.1
- v6.0
- v5.4
- v5.3
- v5.2
- v5.1
- v5.0
- v4.0
- v3.1
- v3.0
- v2.1
- v2.0
- v1.0
- Glossary
Quick Start Guide for PingCAP Clinic
This document describes how to use PingCAP Clinic diagnosis service (PingCAP Clinic) to collect, upload, and view cluster diagnosis data quickly.
PingCAP Clinic consists of two components: Diag client (shorten as Diag) and Clinic Server cloud service (shorten as Clinic Server). For details of these two components, refer to PingCAP Clinic Overview.
User scenarios
- To accurately identify and quickly resolve problems in your cluster when seeking help remotely from PingCAP technical support, you can collect diagnostic data with Diag, upload the collected data to the Clinic Server, and provide the data access link to the technical support.
- When the cluster is running properly and you need to check the status of the cluster, you can use Diag to collect diagnostic data, upload the data to Clinic Server, and view the results of Health Report.
- The following methods to collect and upload data are only applicable to clusters deployed using TiUP. For clusters deployed using TiDB Operator in Kubernetes, see PingCAP Clinic for TiDB Operator environments.
- The diagnostic data collected by PingCAP Clinic is only used for troubleshooting cluster problems.
Prerequisites
Before using PingCAP Clinic, you need to install Diag and prepare an environment for uploading data.
On your control machine with TiUP installed, run the following command to install Diag:
tiup install diagLog in to Clinic Server.
- Clinic Server in the US
- Clinic Server in the Chinese mainland
Go to the Clinic Server in the US and select Sign in with TiDB Account to enter the TiDB Cloud login page. If you do not have a TiDB Cloud account, create one on that page.
NoteA TiDB Cloud account is only used for logging in to Clinic Server in SSO mode and is not mandatory for accessing the TiDB Cloud service.
Go to the Clinic Server in the Chinese mainland and select Sign in with AskTUG to enter the AskTUG community login page. If you do not have an AskTUG account, create one on that page
Create an organization on the Clinic Server. Organization is a collection of TiDB clusters. You can upload diagnostic data on the created organization.
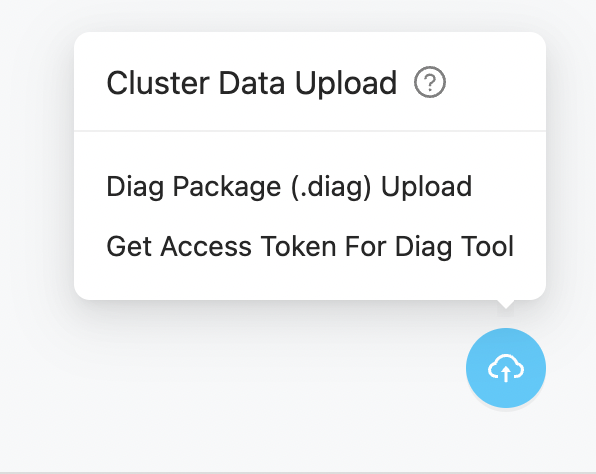
Get an access token to upload data. When uploading collected data through Diag, you need a token for user authentication to ensure the data is isolated securely. If you already get a token from the Clinic Server, you can reuse the token.
To get a token, click the icon in the lower-right corner of the Cluster page, select Get Access Token For Diag Tool, and click + in the pop-up window. Make sure that you have copied and saved the token that is displayed.
 Note
Note- For data security, TiDB only displays the token information when it is created. If you lost the information, you can delete the old token and create a new one.
- A token is only used for uploading data.
Set the token and
regionin Diag.Run the following command to set the
clinic.token:tiup diag config clinic.token ${token-value}Run the following command to set the
clinic.region:
regiondetermines the encryption certificate used for packing data and the target service when uploading the data. For example:Note- Diag v0.9.0 and later versions support setting
region. - For versions earlier than Diag v0.9.0, data is uploaded to Clinic Server in the Chinese region by default. To set
regionin these versions, run thetiup update diagcommand to upgrade Diag to the latest version and then setregionin Diag.
- Clinic Server in the US
- Clinic Server in the Chinese mainland
For Clinic Server in the US, set
regiontoUSusing the following command:tiup diag config clinic.region USFor Clinic Server in the Chinese mainland, set
regiontoCNusing the following command:tiup diag config clinic.region CN(Optional) Enable log redaction.
When TiDB provides detailed log information, it might print sensitive information (for example, user data) in the log. If you want to avoid leaking sensitive information in the local log and Clinic Server, you can enable log redaction in the TiDB side. For more information, see log redaction.
Steps
Run Diag to collect diagnostic data.
For example, to collect the diagnostic data from 4 hours ago to 2 hours ago based on the current time, run the following command:
tiup diag collect ${cluster-name} -f="-4h" -t="-2h"After you run the command, Diag does not start collecting data immediately. Instead, Diag provides the estimated data size and the target data storage path in the output for you to confirm whether to continue. To confirm that you want to start collecting data, enter
Y.After the collection is complete, Diag provides the folder path where the collected data is located.
Upload the collected data to Clinic Server.
NoteThe size of data (the compressed file with collected data) to be uploaded should be no larger than 3 GB. Otherwise, the data upload fails.
If the network where your cluster is located can access the internet, you can directly upload the folder with collected data using the following command:
tiup diag upload ${filepath}After the upload is completed, the
Download URLis displayed in the output.NoteWhen uploading data using this method, you need to use Diag v0.9.0 or a later version. You can get the Diag version when you run it. If the Diag version is earlier than 0.9.0, you can use the
tiup update diagcommand to upgrade Diag to the latest version.If the network where your cluster is located cannot access the internet, you need to pack the collected data and upload the package. For details, see Method 2. Pack and upload data.
After the upload is complete, get the data access link from
Download URLin the command output.By default, the diagnostic data includes the cluster name, cluster topology information, log content in the collected diagnostic data, and Grafana Dashboard information reorganized based on the metrics in the collected data.
You can use the data to troubleshoot cluster problems by yourself, or you can provide the data access link to PingCAP technical support staff to facilitate the remote troubleshooting.
View the results of Health Report
After data is uploaded, Clinic Server processes the data automatically in the background. The Health Report is generated in approximately 5 to 15 minutes. You can view the report by opening the diagnostic data link and click the "Health Report".