- Docs Home
- About TiDB
- Quick Start
- Develop
- Overview
- Quick Start
- Build a TiDB Cluster in TiDB Cloud (Developer Tier)
- CRUD SQL in TiDB
- Build a Simple CRUD App with TiDB
- Example Applications
- Connect to TiDB
- Design Database Schema
- Write Data
- Read Data
- Transaction
- Optimize
- Troubleshoot
- Reference
- Cloud Native Development Environment
- Third-party Support
- Deploy
- Software and Hardware Requirements
- Environment Configuration Checklist
- Plan Cluster Topology
- Install and Start
- Verify Cluster Status
- Test Cluster Performance
- Migrate
- Overview
- Migration Tools
- Migration Scenarios
- Migrate from Aurora
- Migrate MySQL of Small Datasets
- Migrate MySQL of Large Datasets
- Migrate and Merge MySQL Shards of Small Datasets
- Migrate and Merge MySQL Shards of Large Datasets
- Migrate from CSV Files
- Migrate from SQL Files
- Migrate from One TiDB Cluster to Another TiDB Cluster
- Migrate from TiDB to MySQL-compatible Databases
- Advanced Migration
- Integrate
- Maintain
- Monitor and Alert
- Troubleshoot
- TiDB Troubleshooting Map
- Identify Slow Queries
- Analyze Slow Queries
- SQL Diagnostics
- Identify Expensive Queries Using Top SQL
- Identify Expensive Queries Using Logs
- Statement Summary Tables
- Troubleshoot Hotspot Issues
- Troubleshoot Increased Read and Write Latency
- Save and Restore the On-Site Information of a Cluster
- Troubleshoot Cluster Setup
- Troubleshoot High Disk I/O Usage
- Troubleshoot Lock Conflicts
- Troubleshoot TiFlash
- Troubleshoot Write Conflicts in Optimistic Transactions
- Troubleshoot Inconsistency Between Data and Indexes
- Performance Tuning
- Tuning Guide
- Configuration Tuning
- System Tuning
- Software Tuning
- SQL Tuning
- Overview
- Understanding the Query Execution Plan
- SQL Optimization Process
- Overview
- Logic Optimization
- Physical Optimization
- Prepare Execution Plan Cache
- Control Execution Plans
- Tutorials
- TiDB Tools
- Overview
- Use Cases
- Download
- TiUP
- Documentation Map
- Overview
- Terminology and Concepts
- Manage TiUP Components
- FAQ
- Troubleshooting Guide
- Command Reference
- Overview
- TiUP Commands
- TiUP Cluster Commands
- Overview
- tiup cluster audit
- tiup cluster check
- tiup cluster clean
- tiup cluster deploy
- tiup cluster destroy
- tiup cluster disable
- tiup cluster display
- tiup cluster edit-config
- tiup cluster enable
- tiup cluster help
- tiup cluster import
- tiup cluster list
- tiup cluster patch
- tiup cluster prune
- tiup cluster reload
- tiup cluster rename
- tiup cluster replay
- tiup cluster restart
- tiup cluster scale-in
- tiup cluster scale-out
- tiup cluster start
- tiup cluster stop
- tiup cluster template
- tiup cluster upgrade
- TiUP DM Commands
- Overview
- tiup dm audit
- tiup dm deploy
- tiup dm destroy
- tiup dm disable
- tiup dm display
- tiup dm edit-config
- tiup dm enable
- tiup dm help
- tiup dm import
- tiup dm list
- tiup dm patch
- tiup dm prune
- tiup dm reload
- tiup dm replay
- tiup dm restart
- tiup dm scale-in
- tiup dm scale-out
- tiup dm start
- tiup dm stop
- tiup dm template
- tiup dm upgrade
- TiDB Cluster Topology Reference
- DM Cluster Topology Reference
- Mirror Reference Guide
- TiUP Components
- PingCAP Clinic Diagnostic Service
- TiDB Operator
- Dumpling
- TiDB Lightning
- TiDB Data Migration
- About TiDB Data Migration
- Architecture
- Quick Start
- Deploy a DM cluster
- Tutorials
- Advanced Tutorials
- Maintain
- Cluster Upgrade
- Tools
- Performance Tuning
- Manage Data Sources
- Manage Tasks
- Export and Import Data Sources and Task Configurations of Clusters
- Handle Alerts
- Daily Check
- Reference
- Architecture
- Command Line
- Configuration Files
- OpenAPI
- Compatibility Catalog
- Secure
- Monitoring and Alerts
- Error Codes
- Glossary
- Example
- Troubleshoot
- Release Notes
- Backup & Restore (BR)
- TiDB Binlog
- TiCDC
- Dumpling
- sync-diff-inspector
- TiSpark
- Reference
- Cluster Architecture
- Key Monitoring Metrics
- Secure
- Privileges
- SQL
- SQL Language Structure and Syntax
- SQL Statements
ADD COLUMNADD INDEXADMINADMIN CANCEL DDLADMIN CHECKSUM TABLEADMIN CHECK [TABLE|INDEX]ADMIN SHOW DDL [JOBS|QUERIES]ADMIN SHOW TELEMETRYALTER DATABASEALTER INDEXALTER INSTANCEALTER PLACEMENT POLICYALTER TABLEALTER TABLE COMPACTALTER USERANALYZE TABLEBACKUPBATCHBEGINCHANGE COLUMNCOMMITCHANGE DRAINERCHANGE PUMPCREATE [GLOBAL|SESSION] BINDINGCREATE DATABASECREATE INDEXCREATE PLACEMENT POLICYCREATE ROLECREATE SEQUENCECREATE TABLE LIKECREATE TABLECREATE USERCREATE VIEWDEALLOCATEDELETEDESCDESCRIBEDODROP [GLOBAL|SESSION] BINDINGDROP COLUMNDROP DATABASEDROP INDEXDROP PLACEMENT POLICYDROP ROLEDROP SEQUENCEDROP STATSDROP TABLEDROP USERDROP VIEWEXECUTEEXPLAIN ANALYZEEXPLAINFLASHBACK TABLEFLUSH PRIVILEGESFLUSH STATUSFLUSH TABLESGRANT <privileges>GRANT <role>INSERTKILL [TIDB]LOAD DATALOAD STATSMODIFY COLUMNPREPARERECOVER TABLERENAME INDEXRENAME TABLEREPLACERESTOREREVOKE <privileges>REVOKE <role>ROLLBACKSELECTSET DEFAULT ROLESET [NAMES|CHARACTER SET]SET PASSWORDSET ROLESET TRANSACTIONSET [GLOBAL|SESSION] <variable>SHOW ANALYZE STATUSSHOW [BACKUPS|RESTORES]SHOW [GLOBAL|SESSION] BINDINGSSHOW BUILTINSSHOW CHARACTER SETSHOW COLLATIONSHOW [FULL] COLUMNS FROMSHOW CONFIGSHOW CREATE PLACEMENT POLICYSHOW CREATE SEQUENCESHOW CREATE TABLESHOW CREATE USERSHOW DATABASESSHOW DRAINER STATUSSHOW ENGINESSHOW ERRORSSHOW [FULL] FIELDS FROMSHOW GRANTSSHOW INDEX [FROM|IN]SHOW INDEXES [FROM|IN]SHOW KEYS [FROM|IN]SHOW MASTER STATUSSHOW PLACEMENTSHOW PLACEMENT FORSHOW PLACEMENT LABELSSHOW PLUGINSSHOW PRIVILEGESSHOW [FULL] PROCESSSLISTSHOW PROFILESSHOW PUMP STATUSSHOW SCHEMASSHOW STATS_HEALTHYSHOW STATS_HISTOGRAMSSHOW STATS_METASHOW STATUSSHOW TABLE NEXT_ROW_IDSHOW TABLE REGIONSSHOW TABLE STATUSSHOW [FULL] TABLESSHOW [GLOBAL|SESSION] VARIABLESSHOW WARNINGSSHUTDOWNSPLIT REGIONSTART TRANSACTIONTABLETRACETRUNCATEUPDATEUSEWITH
- Data Types
- Functions and Operators
- Overview
- Type Conversion in Expression Evaluation
- Operators
- Control Flow Functions
- String Functions
- Numeric Functions and Operators
- Date and Time Functions
- Bit Functions and Operators
- Cast Functions and Operators
- Encryption and Compression Functions
- Locking Functions
- Information Functions
- JSON Functions
- Aggregate (GROUP BY) Functions
- Window Functions
- Miscellaneous Functions
- Precision Math
- Set Operations
- List of Expressions for Pushdown
- TiDB Specific Functions
- Clustered Indexes
- Constraints
- Generated Columns
- SQL Mode
- Table Attributes
- Transactions
- Garbage Collection (GC)
- Views
- Partitioning
- Temporary Tables
- Cached Tables
- Character Set and Collation
- Placement Rules in SQL
- System Tables
mysql- INFORMATION_SCHEMA
- Overview
ANALYZE_STATUSCLIENT_ERRORS_SUMMARY_BY_HOSTCLIENT_ERRORS_SUMMARY_BY_USERCLIENT_ERRORS_SUMMARY_GLOBALCHARACTER_SETSCLUSTER_CONFIGCLUSTER_HARDWARECLUSTER_INFOCLUSTER_LOADCLUSTER_LOGCLUSTER_SYSTEMINFOCOLLATIONSCOLLATION_CHARACTER_SET_APPLICABILITYCOLUMNSDATA_LOCK_WAITSDDL_JOBSDEADLOCKSENGINESINSPECTION_RESULTINSPECTION_RULESINSPECTION_SUMMARYKEY_COLUMN_USAGEMETRICS_SUMMARYMETRICS_TABLESPARTITIONSPLACEMENT_POLICIESPROCESSLISTREFERENTIAL_CONSTRAINTSSCHEMATASEQUENCESSESSION_VARIABLESSLOW_QUERYSTATISTICSTABLESTABLE_CONSTRAINTSTABLE_STORAGE_STATSTIDB_HOT_REGIONSTIDB_HOT_REGIONS_HISTORYTIDB_INDEXESTIDB_SERVERS_INFOTIDB_TRXTIFLASH_REPLICATIKV_REGION_PEERSTIKV_REGION_STATUSTIKV_STORE_STATUSUSER_PRIVILEGESVIEWS
METRICS_SCHEMA
- UI
- TiDB Dashboard
- Overview
- Maintain
- Access
- Overview Page
- Cluster Info Page
- Top SQL Page
- Key Visualizer Page
- Metrics Relation Graph
- SQL Statements Analysis
- Slow Queries Page
- Cluster Diagnostics
- Search Logs Page
- Instance Profiling
- Session Management and Configuration
- FAQ
- CLI
- Command Line Flags
- Configuration File Parameters
- System Variables
- Storage Engines
- Telemetry
- Errors Codes
- Table Filter
- Schedule Replicas by Topology Labels
- FAQs
- Release Notes
- All Releases
- Release Timeline
- TiDB Versioning
- v6.1
- v6.0
- v5.4
- v5.3
- v5.2
- v5.1
- v5.0
- v4.0
- v3.1
- v3.0
- v2.1
- v2.0
- v1.0
- Glossary
Key Metrics
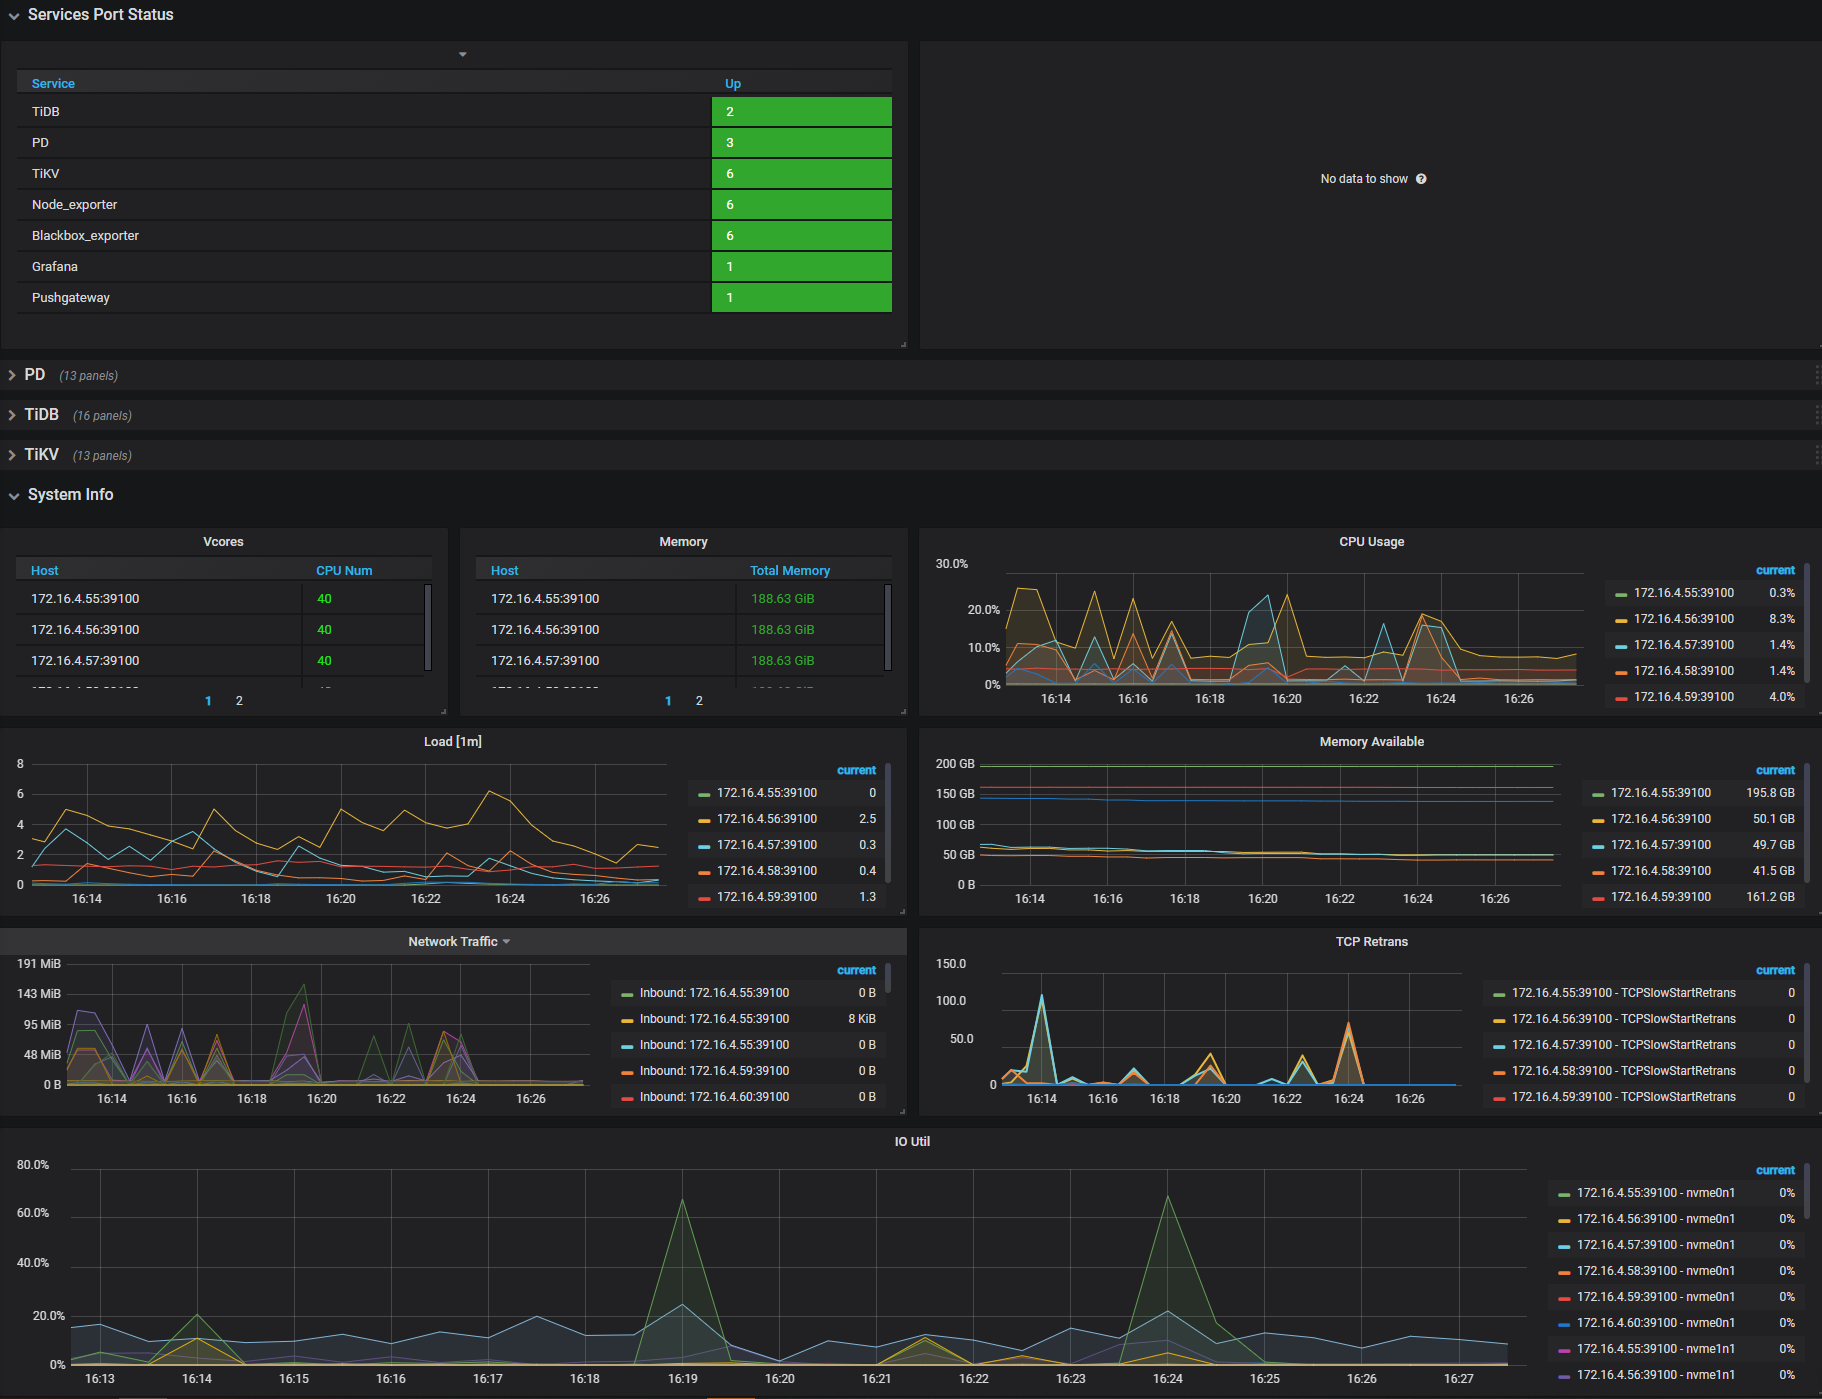
If you use TiUP to deploy the TiDB cluster, the monitoring system (Prometheus & Grafana) is deployed at the same time. For more information, see TiDB Monitoring Framework Overview.
The Grafana dashboard is divided into a series of sub dashboards which include Overview, PD, TiDB, TiKV, Node_exporter, Disk Performance, Performance_overview, and so on. A lot of metrics are there to help you diagnose.
For routine operations, you can get an overview of the component (PD, TiDB, TiKV) status and the entire cluster from the Overview dashboard, where the key metrics are displayed. This document provides a detailed description of these key metrics.
Key metrics description
To understand the key metrics displayed on the Overview dashboard, check the following table:
| Service | Panel Name | Description | Normal Range |
|---|---|---|---|
| Services Port Status | Services Up | The online nodes number of each service. | |
| PD | PD role | The role of the current PD. | |
| PD | Storage capacity | The total storage capacity of the TiDB cluster. | |
| PD | Current storage size | The occupied storage capacity of the TiDB cluster, including the space occupied by TiKV replicas. | |
| PD | Normal stores | The number of nodes in the normal state. | |
| PD | Abnormal stores | The number of nodes in the abnormal state. | 0 |
| PD | Number of Regions | The total number of Regions in the current cluster. Note that the number of Regions has nothing to do with the number of replicas. | |
| PD | 99% completed_cmds_duration_seconds | The 99th percentile duration to complete a pd-server request. | less than 5ms |
| PD | Handle_requests_duration_seconds | The network duration of a PD request. | |
| PD | Region health | The state of each Region. | Generally, the number of pending peers is less than 100, and that of the missing peers cannot always be greater than 0. |
| PD | Hot write Region's leader distribution | The total number of leaders who are the write hotspots on each TiKV instance. | |
| PD | Hot read Region's leader distribution | The total number of leaders who are the read hotspots on each TiKV instance. | |
| PD | Region heartbeat report | The count of heartbeats reported to PD per instance. | |
| PD | 99% Region heartbeat latency | The heartbeat latency per TiKV instance (P99). | |
| TiDB | Statement OPS | The number of different types of SQL statements executed per second, which is counted according to SELECT, INSERT, UPDATE, and other types of statements. | |
| TiDB | Duration | The execution time. 1. The duration between the time that the client's network request is sent to TiDB and the time that the request is returned to the client after TiDB has executed the request. In general, client requests are sent in the form of SQL statements; however, this duration can include the execution time of commands such as COM_PING, COM_SLEEP, COM_STMT_FETCH, and COM_SEND_LONG_DATA.2. Because TiDB supports Multi-Query, TiDB supports sending multiple SQL statements at one time, such as select 1; select 1; select 1;. In this case, the total execution time of this query includes the execution time of all SQL statements. | |
| TiDB | CPS By Instance | CPS By Instance: the command statistics on each TiDB instance, which is classified according to the success or failure of command execution results. | |
| TiDB | Failed Query OPM | The statistics of error types (such as syntax errors and primary key conflicts) based on the errors occurred when executing SQL statements per second on each TiDB instance. The module in which the error occurs and the error code are included. | |
| TiDB | Connection Count | The connection number of each TiDB instance. | |
| TiDB | Memory Usage | The memory usage statistics of each TiDB instance, which is divided into the memory occupied by processes and the memory applied by Golang on the heap. | |
| TiDB | Transaction OPS | The number of transactions executed per second. | |
| TiDB | Transaction Duration | The execution time of a transaction | |
| TiDB | KV Cmd OPS | The number of executed KV commands. | |
| TiDB | KV Cmd Duration 99 | The execution time of the KV command. | |
| TiDB | PD TSO OPS | The number of TSO that TiDB obtains from PD per second. | |
| TiDB | PD TSO Wait Duration | The duration that TiDB waits for PD to return TSO. | |
| TiDB | TiClient Region Error OPS | The number of Region related errors returned by TiKV. | |
| TiDB | Lock Resolve OPS | The number of TiDB operations that resolve locks. When TiDB's read or write request encounters a lock, it tries to resolve the lock. | |
| TiDB | KV Backoff OPS | The number of errors returned by TiKV. | |
| TiKV | leader | The number of leaders on each TiKV node. | |
| TiKV | region | The number of Regions on each TiKV node. | |
| TiKV | CPU | The CPU usage ratio on each TiKV node. | |
| TiKV | Memory | The memory usage on each TiKV node. | |
| TiKV | store size | The size of storage space used by each TiKV instance. | |
| TiKV | cf size | The size of each column family (CF for short). | |
| TiKV | channel full | The number of "channel full" errors on each TiKV instance. | 0 |
| TiKV | server report failures | The number of error messages reported by each TiKV instance. | 0 |
| TiKV | scheduler pending commands | The number of pending commands on each TiKV instance. | |
| TiKV | coprocessor executor count | The number of coprocessor operations received by TiKV per second. Each type of coprocessor is counted separately. | |
| TiKV | coprocessor request duration | The time consumed to process read requests of coprocessor. | |
| TiKV | raft store CPU | The CPU usage ratio of the raftstore thread | The default number of threads is 2 (configured by raftstore.store-pool-size). A value of over 80% for a single thread indicates that the CPU usage ratio is very high. |
| TiKV | Coprocessor CPU | The CPU usage ratio of the coprocessor thread. | |
| System Info | Vcores | The number of CPU cores. | |
| System Info | Memory | The total memory. | |
| System Info | CPU Usage | The CPU usage ratio, 100% at a maximum. | |
| System Info | Load [1m] | The overload within 1 minute. | |
| System Info | Memory Available | The size of the available memory. | |
| System Info | Network Traffic | The statistics of the network traffic. | |
| System Info | TCP Retrans | The frequency of the TOC retransmission. | |
| System Info | IO Util | The disk usage ratio, 100% at a maximum; generally you need to consider adding a new node when the usage ratio is up to 80% ~ 90%. |
Interface of the Overview dashboard
Was this page helpful?