- Docs Home
- About TiDB
- Quick Start
- Develop
- Overview
- Quick Start
- Build a TiDB Cluster in TiDB Cloud (Developer Tier)
- CRUD SQL in TiDB
- Build a Simple CRUD App with TiDB
- Example Applications
- Connect to TiDB
- Design Database Schema
- Write Data
- Read Data
- Transaction
- Optimize
- Troubleshoot
- Reference
- Cloud Native Development Environment
- Third-party Support
- Deploy
- Software and Hardware Requirements
- Environment Configuration Checklist
- Plan Cluster Topology
- Install and Start
- Verify Cluster Status
- Test Cluster Performance
- Migrate
- Overview
- Migration Tools
- Migration Scenarios
- Migrate from Aurora
- Migrate MySQL of Small Datasets
- Migrate MySQL of Large Datasets
- Migrate and Merge MySQL Shards of Small Datasets
- Migrate and Merge MySQL Shards of Large Datasets
- Migrate from CSV Files
- Migrate from SQL Files
- Migrate from One TiDB Cluster to Another TiDB Cluster
- Migrate from TiDB to MySQL-compatible Databases
- Advanced Migration
- Integrate
- Maintain
- Monitor and Alert
- Troubleshoot
- TiDB Troubleshooting Map
- Identify Slow Queries
- Analyze Slow Queries
- SQL Diagnostics
- Identify Expensive Queries Using Top SQL
- Identify Expensive Queries Using Logs
- Statement Summary Tables
- Troubleshoot Hotspot Issues
- Troubleshoot Increased Read and Write Latency
- Save and Restore the On-Site Information of a Cluster
- Troubleshoot Cluster Setup
- Troubleshoot High Disk I/O Usage
- Troubleshoot Lock Conflicts
- Troubleshoot TiFlash
- Troubleshoot Write Conflicts in Optimistic Transactions
- Troubleshoot Inconsistency Between Data and Indexes
- Performance Tuning
- Tuning Guide
- Configuration Tuning
- System Tuning
- Software Tuning
- SQL Tuning
- Overview
- Understanding the Query Execution Plan
- SQL Optimization Process
- Overview
- Logic Optimization
- Physical Optimization
- Prepare Execution Plan Cache
- Control Execution Plans
- Tutorials
- TiDB Tools
- Overview
- Use Cases
- Download
- TiUP
- Documentation Map
- Overview
- Terminology and Concepts
- Manage TiUP Components
- FAQ
- Troubleshooting Guide
- Command Reference
- Overview
- TiUP Commands
- TiUP Cluster Commands
- Overview
- tiup cluster audit
- tiup cluster check
- tiup cluster clean
- tiup cluster deploy
- tiup cluster destroy
- tiup cluster disable
- tiup cluster display
- tiup cluster edit-config
- tiup cluster enable
- tiup cluster help
- tiup cluster import
- tiup cluster list
- tiup cluster patch
- tiup cluster prune
- tiup cluster reload
- tiup cluster rename
- tiup cluster replay
- tiup cluster restart
- tiup cluster scale-in
- tiup cluster scale-out
- tiup cluster start
- tiup cluster stop
- tiup cluster template
- tiup cluster upgrade
- TiUP DM Commands
- Overview
- tiup dm audit
- tiup dm deploy
- tiup dm destroy
- tiup dm disable
- tiup dm display
- tiup dm edit-config
- tiup dm enable
- tiup dm help
- tiup dm import
- tiup dm list
- tiup dm patch
- tiup dm prune
- tiup dm reload
- tiup dm replay
- tiup dm restart
- tiup dm scale-in
- tiup dm scale-out
- tiup dm start
- tiup dm stop
- tiup dm template
- tiup dm upgrade
- TiDB Cluster Topology Reference
- DM Cluster Topology Reference
- Mirror Reference Guide
- TiUP Components
- PingCAP Clinic Diagnostic Service
- TiDB Operator
- Dumpling
- TiDB Lightning
- TiDB Data Migration
- About TiDB Data Migration
- Architecture
- Quick Start
- Deploy a DM cluster
- Tutorials
- Advanced Tutorials
- Maintain
- Cluster Upgrade
- Tools
- Performance Tuning
- Manage Data Sources
- Manage Tasks
- Export and Import Data Sources and Task Configurations of Clusters
- Handle Alerts
- Daily Check
- Reference
- Architecture
- Command Line
- Configuration Files
- OpenAPI
- Compatibility Catalog
- Secure
- Monitoring and Alerts
- Error Codes
- Glossary
- Example
- Troubleshoot
- Release Notes
- Backup & Restore (BR)
- TiDB Binlog
- TiCDC
- Dumpling
- sync-diff-inspector
- TiSpark
- Reference
- Cluster Architecture
- Key Monitoring Metrics
- Secure
- Privileges
- SQL
- SQL Language Structure and Syntax
- SQL Statements
ADD COLUMNADD INDEXADMINADMIN CANCEL DDLADMIN CHECKSUM TABLEADMIN CHECK [TABLE|INDEX]ADMIN SHOW DDL [JOBS|QUERIES]ADMIN SHOW TELEMETRYALTER DATABASEALTER INDEXALTER INSTANCEALTER PLACEMENT POLICYALTER TABLEALTER TABLE COMPACTALTER USERANALYZE TABLEBACKUPBATCHBEGINCHANGE COLUMNCOMMITCHANGE DRAINERCHANGE PUMPCREATE [GLOBAL|SESSION] BINDINGCREATE DATABASECREATE INDEXCREATE PLACEMENT POLICYCREATE ROLECREATE SEQUENCECREATE TABLE LIKECREATE TABLECREATE USERCREATE VIEWDEALLOCATEDELETEDESCDESCRIBEDODROP [GLOBAL|SESSION] BINDINGDROP COLUMNDROP DATABASEDROP INDEXDROP PLACEMENT POLICYDROP ROLEDROP SEQUENCEDROP STATSDROP TABLEDROP USERDROP VIEWEXECUTEEXPLAIN ANALYZEEXPLAINFLASHBACK TABLEFLUSH PRIVILEGESFLUSH STATUSFLUSH TABLESGRANT <privileges>GRANT <role>INSERTKILL [TIDB]LOAD DATALOAD STATSMODIFY COLUMNPREPARERECOVER TABLERENAME INDEXRENAME TABLEREPLACERESTOREREVOKE <privileges>REVOKE <role>ROLLBACKSELECTSET DEFAULT ROLESET [NAMES|CHARACTER SET]SET PASSWORDSET ROLESET TRANSACTIONSET [GLOBAL|SESSION] <variable>SHOW ANALYZE STATUSSHOW [BACKUPS|RESTORES]SHOW [GLOBAL|SESSION] BINDINGSSHOW BUILTINSSHOW CHARACTER SETSHOW COLLATIONSHOW [FULL] COLUMNS FROMSHOW CONFIGSHOW CREATE PLACEMENT POLICYSHOW CREATE SEQUENCESHOW CREATE TABLESHOW CREATE USERSHOW DATABASESSHOW DRAINER STATUSSHOW ENGINESSHOW ERRORSSHOW [FULL] FIELDS FROMSHOW GRANTSSHOW INDEX [FROM|IN]SHOW INDEXES [FROM|IN]SHOW KEYS [FROM|IN]SHOW MASTER STATUSSHOW PLACEMENTSHOW PLACEMENT FORSHOW PLACEMENT LABELSSHOW PLUGINSSHOW PRIVILEGESSHOW [FULL] PROCESSSLISTSHOW PROFILESSHOW PUMP STATUSSHOW SCHEMASSHOW STATS_HEALTHYSHOW STATS_HISTOGRAMSSHOW STATS_METASHOW STATUSSHOW TABLE NEXT_ROW_IDSHOW TABLE REGIONSSHOW TABLE STATUSSHOW [FULL] TABLESSHOW [GLOBAL|SESSION] VARIABLESSHOW WARNINGSSHUTDOWNSPLIT REGIONSTART TRANSACTIONTABLETRACETRUNCATEUPDATEUSEWITH
- Data Types
- Functions and Operators
- Overview
- Type Conversion in Expression Evaluation
- Operators
- Control Flow Functions
- String Functions
- Numeric Functions and Operators
- Date and Time Functions
- Bit Functions and Operators
- Cast Functions and Operators
- Encryption and Compression Functions
- Locking Functions
- Information Functions
- JSON Functions
- Aggregate (GROUP BY) Functions
- Window Functions
- Miscellaneous Functions
- Precision Math
- Set Operations
- List of Expressions for Pushdown
- TiDB Specific Functions
- Clustered Indexes
- Constraints
- Generated Columns
- SQL Mode
- Table Attributes
- Transactions
- Garbage Collection (GC)
- Views
- Partitioning
- Temporary Tables
- Cached Tables
- Character Set and Collation
- Placement Rules in SQL
- System Tables
mysql- INFORMATION_SCHEMA
- Overview
ANALYZE_STATUSCLIENT_ERRORS_SUMMARY_BY_HOSTCLIENT_ERRORS_SUMMARY_BY_USERCLIENT_ERRORS_SUMMARY_GLOBALCHARACTER_SETSCLUSTER_CONFIGCLUSTER_HARDWARECLUSTER_INFOCLUSTER_LOADCLUSTER_LOGCLUSTER_SYSTEMINFOCOLLATIONSCOLLATION_CHARACTER_SET_APPLICABILITYCOLUMNSDATA_LOCK_WAITSDDL_JOBSDEADLOCKSENGINESINSPECTION_RESULTINSPECTION_RULESINSPECTION_SUMMARYKEY_COLUMN_USAGEMETRICS_SUMMARYMETRICS_TABLESPARTITIONSPLACEMENT_POLICIESPROCESSLISTREFERENTIAL_CONSTRAINTSSCHEMATASEQUENCESSESSION_VARIABLESSLOW_QUERYSTATISTICSTABLESTABLE_CONSTRAINTSTABLE_STORAGE_STATSTIDB_HOT_REGIONSTIDB_HOT_REGIONS_HISTORYTIDB_INDEXESTIDB_SERVERS_INFOTIDB_TRXTIFLASH_REPLICATIKV_REGION_PEERSTIKV_REGION_STATUSTIKV_STORE_STATUSUSER_PRIVILEGESVIEWS
METRICS_SCHEMA
- UI
- TiDB Dashboard
- Overview
- Maintain
- Access
- Overview Page
- Cluster Info Page
- Top SQL Page
- Key Visualizer Page
- Metrics Relation Graph
- SQL Statements Analysis
- Slow Queries Page
- Cluster Diagnostics
- Search Logs Page
- Instance Profiling
- Session Management and Configuration
- FAQ
- CLI
- Command Line Flags
- Configuration File Parameters
- System Variables
- Storage Engines
- Telemetry
- Errors Codes
- Table Filter
- Schedule Replicas by Topology Labels
- FAQs
- Release Notes
- All Releases
- Release Timeline
- TiDB Versioning
- v6.1
- v6.0
- v5.4
- v5.3
- v5.2
- v5.1
- v5.0
- v4.0
- v3.1
- v3.0
- v2.1
- v2.0
- v1.0
- Glossary
Deploy Monitoring Services for the TiDB Cluster
This document is intended for users who want to manually deploy TiDB monitoring and alert services.
If you deploy the TiDB cluster using TiUP, the monitoring and alert services are automatically deployed, and no manual deployment is needed.
Deploy Prometheus and Grafana
Assume that the TiDB cluster topology is as follows:
| Name | Host IP | Services |
|---|---|---|
| Node1 | 192.168.199.113 | PD1, TiDB, node_export, Prometheus, Grafana |
| Node2 | 192.168.199.114 | PD2, node_export |
| Node3 | 192.168.199.115 | PD3, node_export |
| Node4 | 192.168.199.116 | TiKV1, node_export |
| Node5 | 192.168.199.117 | TiKV2, node_export |
| Node6 | 192.168.199.118 | TiKV3, node_export |
Step 1: Download the binary package
# Downloads the package.
wget https://download.pingcap.org/prometheus-2.27.1.linux-amd64.tar.gz
wget https://download.pingcap.org/node_exporter-0.17.0.linux-amd64.tar.gz
wget https://download.pingcap.org/grafana-6.1.6.linux-amd64.tar.gz
# Extracts the package.
tar -xzf prometheus-2.27.1.linux-amd64.tar.gz
tar -xzf node_exporter-0.17.0.linux-amd64.tar.gz
tar -xzf grafana-6.1.6.linux-amd64.tar.gz
Step 2: Start node_exporter on Node1, Node2, Node3, and Node4
cd node_exporter-0.17.0.linux-amd64

# Starts the node_exporter service.
$ ./node_exporter --web.listen-address=":9100" \
    --log.level="info" &
Step 3: Start Prometheus on Node1
Edit the Prometheus configuration file:
cd prometheus-2.27.1.linux-amd64 &&
vi prometheus.yml
...

global:
  scrape_interval:     15s  # By default, scrape targets every 15 seconds.
  evaluation_interval: 15s  # By default, scrape targets every 15 seconds.
  # scrape_timeout is set to the global default value (10s).
  external_labels:
    cluster: 'test-cluster'
    monitor: "prometheus"

scrape_configs:
  - job_name: 'overwritten-nodes'
    honor_labels: true  # Do not overwrite job & instance labels.
    static_configs:
    - targets:
      - '192.168.199.113:9100'
      - '192.168.199.114:9100'
      - '192.168.199.115:9100'
      - '192.168.199.116:9100'
      - '192.168.199.117:9100'
      - '192.168.199.118:9100'

  - job_name: 'tidb'
    honor_labels: true  # Do not overwrite job & instance labels.
    static_configs:
    - targets:
      - '192.168.199.113:10080'

  - job_name: 'pd'
    honor_labels: true  # Do not overwrite job & instance labels.
    static_configs:
    - targets:
      - '192.168.199.113:2379'
      - '192.168.199.114:2379'
      - '192.168.199.115:2379'

  - job_name: 'tikv'
    honor_labels: true  # Do not overwrite job & instance labels.
    static_configs:
    - targets:
      - '192.168.199.116:20180'
      - '192.168.199.117:20180'
      - '192.168.199.118:20180'

...
Start the Prometheus service:
$ ./prometheus \
    --config.file="./prometheus.yml" \
    --web.listen-address=":9090" \
    --web.external-url="http://192.168.199.113:9090/" \
    --web.enable-admin-api \
    --log.level="info" \
    --storage.tsdb.path="./data.metrics" \
    --storage.tsdb.retention="15d" &
Step 4: Start Grafana on Node1
Edit the Grafana configuration file:
cd grafana-6.1.6 &&
vi conf/grafana.ini

...

[paths]
data = ./data
logs = ./data/log
plugins = ./data/plugins
[server]
http_port = 3000
domain = 192.168.199.113
[database]
[session]
[analytics]
check_for_updates = true
[security]
admin_user = admin
admin_password = admin
[snapshots]
[users]
[auth.anonymous]
[auth.basic]
[auth.ldap]
[smtp]
[emails]
[log]
mode = file
[log.console]
[log.file]
level = info
format = text
[log.syslog]
[event_publisher]
[dashboards.json]
enabled = false
path = ./data/dashboards
[metrics]
[grafana_net]
url = https://grafana.net

...
Start the Grafana service:
./bin/grafana-server \
    --config="./conf/grafana.ini" &
Configure Grafana
This section describes how to configure Grafana.
Step 1: Add a Prometheus data source
Log in to the Grafana Web interface.
- Default address: http://localhost:3000
- Default account: admin
- Default password: admin
NoteFor the Change Password step, you can choose Skip.
In the Grafana sidebar menu, click Data Source within the Configuration.
Click Add data source.
Specify the data source information.
- Specify a Name for the data source.
- For Type, select Prometheus.
- For URL, specify the Prometheus address.
- Specify other fields as needed.
Click Add to save the new data source.
Step 2: Import a Grafana dashboard
To import a Grafana dashboard for the PD server, the TiKV server, and the TiDB server, take the following steps respectively:
Click the Grafana logo to open the sidebar menu.
In the sidebar menu, click Dashboards -> Import to open the Import Dashboard window.
Click Upload .json File to upload a JSON file (Download TiDB Grafana configuration files from pingcap/tidb, tikv/tikv, and tikv/pd).
NoteFor the TiKV, PD, and TiDB dashboards, the corresponding JSON files are
tikv_summary.json,tikv_details.json,tikv_trouble_shooting.json,pd.json,tidb.json, andtidb_summary.json.Click Load.
Select a Prometheus data source.
Click Import. A Prometheus dashboard is imported.
View component metrics
Click New dashboard in the top menu and choose the dashboard you want to view.
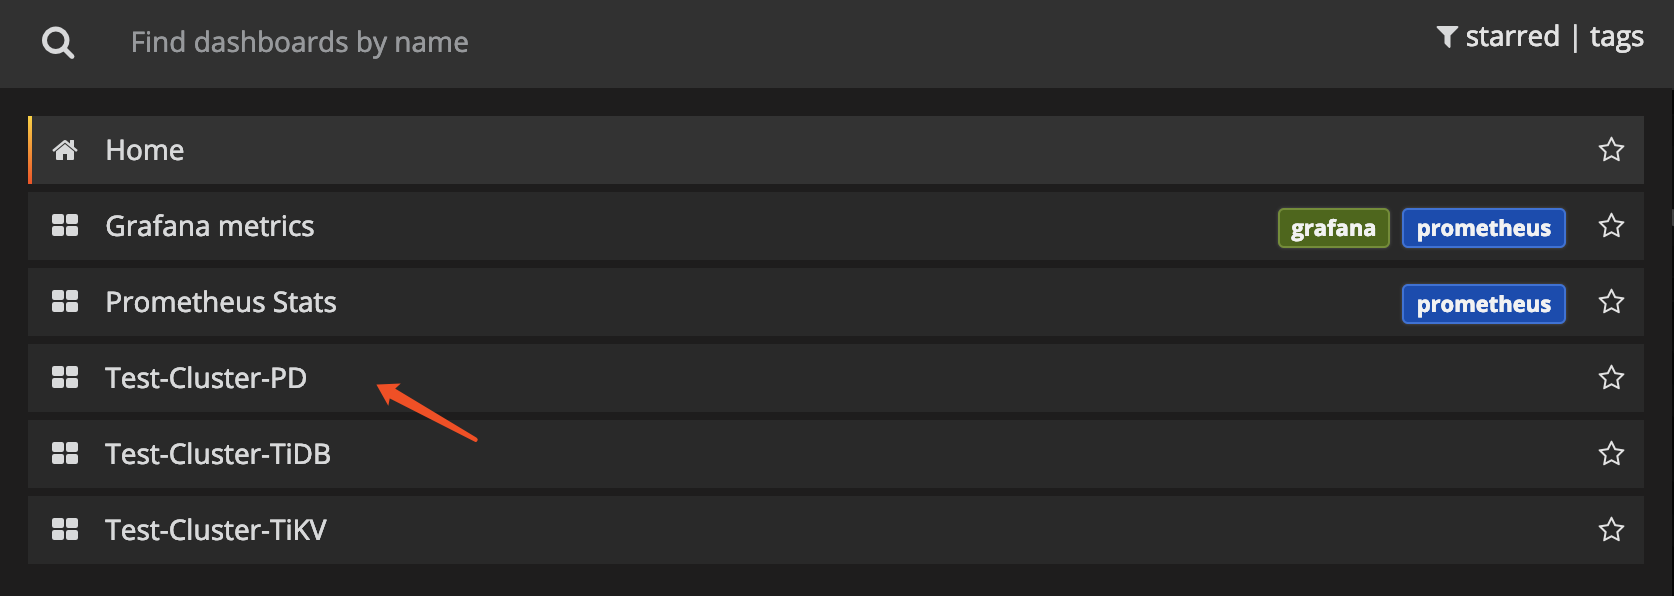
You can get the following metrics for cluster components:
TiDB server:
- Query processing time to monitor the latency and throughput
- The DDL process monitoring
- TiKV client related monitoring
- PD client related monitoring
PD server:
- The total number of times that the command executes
- The total number of times that a certain command fails
- The duration that a command succeeds
- The duration that a command fails
- The duration that a command finishes and returns result
TiKV server:
- Garbage Collection (GC) monitoring
- The total number of times that the TiKV command executes
- The duration that Scheduler executes commands
- The total number of times of the Raft propose command
- The duration that Raft executes commands
- The total number of times that Raft commands fail
- The total number of times that Raft processes the ready state