- Docs Home
- About TiDB
- Quick Start
- Develop
- Overview
- Quick Start
- Build a TiDB Cluster in TiDB Cloud (Developer Tier)
- CRUD SQL in TiDB
- Build a Simple CRUD App with TiDB
- Example Applications
- Connect to TiDB
- Design Database Schema
- Write Data
- Read Data
- Transaction
- Optimize
- Troubleshoot
- Reference
- Cloud Native Development Environment
- Third-party Support
- Deploy
- Software and Hardware Requirements
- Environment Configuration Checklist
- Plan Cluster Topology
- Install and Start
- Verify Cluster Status
- Test Cluster Performance
- Migrate
- Overview
- Migration Tools
- Migration Scenarios
- Migrate from Aurora
- Migrate MySQL of Small Datasets
- Migrate MySQL of Large Datasets
- Migrate and Merge MySQL Shards of Small Datasets
- Migrate and Merge MySQL Shards of Large Datasets
- Migrate from CSV Files
- Migrate from SQL Files
- Migrate from One TiDB Cluster to Another TiDB Cluster
- Migrate from TiDB to MySQL-compatible Databases
- Advanced Migration
- Integrate
- Maintain
- Monitor and Alert
- Troubleshoot
- TiDB Troubleshooting Map
- Identify Slow Queries
- Analyze Slow Queries
- SQL Diagnostics
- Identify Expensive Queries Using Top SQL
- Identify Expensive Queries Using Logs
- Statement Summary Tables
- Troubleshoot Hotspot Issues
- Troubleshoot Increased Read and Write Latency
- Save and Restore the On-Site Information of a Cluster
- Troubleshoot Cluster Setup
- Troubleshoot High Disk I/O Usage
- Troubleshoot Lock Conflicts
- Troubleshoot TiFlash
- Troubleshoot Write Conflicts in Optimistic Transactions
- Troubleshoot Inconsistency Between Data and Indexes
- Performance Tuning
- Tuning Guide
- Configuration Tuning
- System Tuning
- Software Tuning
- SQL Tuning
- Overview
- Understanding the Query Execution Plan
- SQL Optimization Process
- Overview
- Logic Optimization
- Physical Optimization
- Prepare Execution Plan Cache
- Control Execution Plans
- Tutorials
- TiDB Tools
- Overview
- Use Cases
- Download
- TiUP
- Documentation Map
- Overview
- Terminology and Concepts
- Manage TiUP Components
- FAQ
- Troubleshooting Guide
- Command Reference
- Overview
- TiUP Commands
- TiUP Cluster Commands
- Overview
- tiup cluster audit
- tiup cluster check
- tiup cluster clean
- tiup cluster deploy
- tiup cluster destroy
- tiup cluster disable
- tiup cluster display
- tiup cluster edit-config
- tiup cluster enable
- tiup cluster help
- tiup cluster import
- tiup cluster list
- tiup cluster patch
- tiup cluster prune
- tiup cluster reload
- tiup cluster rename
- tiup cluster replay
- tiup cluster restart
- tiup cluster scale-in
- tiup cluster scale-out
- tiup cluster start
- tiup cluster stop
- tiup cluster template
- tiup cluster upgrade
- TiUP DM Commands
- Overview
- tiup dm audit
- tiup dm deploy
- tiup dm destroy
- tiup dm disable
- tiup dm display
- tiup dm edit-config
- tiup dm enable
- tiup dm help
- tiup dm import
- tiup dm list
- tiup dm patch
- tiup dm prune
- tiup dm reload
- tiup dm replay
- tiup dm restart
- tiup dm scale-in
- tiup dm scale-out
- tiup dm start
- tiup dm stop
- tiup dm template
- tiup dm upgrade
- TiDB Cluster Topology Reference
- DM Cluster Topology Reference
- Mirror Reference Guide
- TiUP Components
- PingCAP Clinic Diagnostic Service
- TiDB Operator
- Dumpling
- TiDB Lightning
- TiDB Data Migration
- About TiDB Data Migration
- Architecture
- Quick Start
- Deploy a DM cluster
- Tutorials
- Advanced Tutorials
- Maintain
- Cluster Upgrade
- Tools
- Performance Tuning
- Manage Data Sources
- Manage Tasks
- Export and Import Data Sources and Task Configurations of Clusters
- Handle Alerts
- Daily Check
- Reference
- Architecture
- Command Line
- Configuration Files
- OpenAPI
- Compatibility Catalog
- Secure
- Monitoring and Alerts
- Error Codes
- Glossary
- Example
- Troubleshoot
- Release Notes
- Backup & Restore (BR)
- TiDB Binlog
- TiCDC
- Dumpling
- sync-diff-inspector
- TiSpark
- Reference
- Cluster Architecture
- Key Monitoring Metrics
- Secure
- Privileges
- SQL
- SQL Language Structure and Syntax
- SQL Statements
ADD COLUMNADD INDEXADMINADMIN CANCEL DDLADMIN CHECKSUM TABLEADMIN CHECK [TABLE|INDEX]ADMIN SHOW DDL [JOBS|QUERIES]ADMIN SHOW TELEMETRYALTER DATABASEALTER INDEXALTER INSTANCEALTER PLACEMENT POLICYALTER TABLEALTER TABLE COMPACTALTER USERANALYZE TABLEBACKUPBATCHBEGINCHANGE COLUMNCOMMITCHANGE DRAINERCHANGE PUMPCREATE [GLOBAL|SESSION] BINDINGCREATE DATABASECREATE INDEXCREATE PLACEMENT POLICYCREATE ROLECREATE SEQUENCECREATE TABLE LIKECREATE TABLECREATE USERCREATE VIEWDEALLOCATEDELETEDESCDESCRIBEDODROP [GLOBAL|SESSION] BINDINGDROP COLUMNDROP DATABASEDROP INDEXDROP PLACEMENT POLICYDROP ROLEDROP SEQUENCEDROP STATSDROP TABLEDROP USERDROP VIEWEXECUTEEXPLAIN ANALYZEEXPLAINFLASHBACK TABLEFLUSH PRIVILEGESFLUSH STATUSFLUSH TABLESGRANT <privileges>GRANT <role>INSERTKILL [TIDB]LOAD DATALOAD STATSMODIFY COLUMNPREPARERECOVER TABLERENAME INDEXRENAME TABLEREPLACERESTOREREVOKE <privileges>REVOKE <role>ROLLBACKSELECTSET DEFAULT ROLESET [NAMES|CHARACTER SET]SET PASSWORDSET ROLESET TRANSACTIONSET [GLOBAL|SESSION] <variable>SHOW ANALYZE STATUSSHOW [BACKUPS|RESTORES]SHOW [GLOBAL|SESSION] BINDINGSSHOW BUILTINSSHOW CHARACTER SETSHOW COLLATIONSHOW [FULL] COLUMNS FROMSHOW CONFIGSHOW CREATE PLACEMENT POLICYSHOW CREATE SEQUENCESHOW CREATE TABLESHOW CREATE USERSHOW DATABASESSHOW DRAINER STATUSSHOW ENGINESSHOW ERRORSSHOW [FULL] FIELDS FROMSHOW GRANTSSHOW INDEX [FROM|IN]SHOW INDEXES [FROM|IN]SHOW KEYS [FROM|IN]SHOW MASTER STATUSSHOW PLACEMENTSHOW PLACEMENT FORSHOW PLACEMENT LABELSSHOW PLUGINSSHOW PRIVILEGESSHOW [FULL] PROCESSSLISTSHOW PROFILESSHOW PUMP STATUSSHOW SCHEMASSHOW STATS_HEALTHYSHOW STATS_HISTOGRAMSSHOW STATS_METASHOW STATUSSHOW TABLE NEXT_ROW_IDSHOW TABLE REGIONSSHOW TABLE STATUSSHOW [FULL] TABLESSHOW [GLOBAL|SESSION] VARIABLESSHOW WARNINGSSHUTDOWNSPLIT REGIONSTART TRANSACTIONTABLETRACETRUNCATEUPDATEUSEWITH
- Data Types
- Functions and Operators
- Overview
- Type Conversion in Expression Evaluation
- Operators
- Control Flow Functions
- String Functions
- Numeric Functions and Operators
- Date and Time Functions
- Bit Functions and Operators
- Cast Functions and Operators
- Encryption and Compression Functions
- Locking Functions
- Information Functions
- JSON Functions
- Aggregate (GROUP BY) Functions
- Window Functions
- Miscellaneous Functions
- Precision Math
- Set Operations
- List of Expressions for Pushdown
- TiDB Specific Functions
- Clustered Indexes
- Constraints
- Generated Columns
- SQL Mode
- Table Attributes
- Transactions
- Garbage Collection (GC)
- Views
- Partitioning
- Temporary Tables
- Cached Tables
- Character Set and Collation
- Placement Rules in SQL
- System Tables
mysql- INFORMATION_SCHEMA
- Overview
ANALYZE_STATUSCLIENT_ERRORS_SUMMARY_BY_HOSTCLIENT_ERRORS_SUMMARY_BY_USERCLIENT_ERRORS_SUMMARY_GLOBALCHARACTER_SETSCLUSTER_CONFIGCLUSTER_HARDWARECLUSTER_INFOCLUSTER_LOADCLUSTER_LOGCLUSTER_SYSTEMINFOCOLLATIONSCOLLATION_CHARACTER_SET_APPLICABILITYCOLUMNSDATA_LOCK_WAITSDDL_JOBSDEADLOCKSENGINESINSPECTION_RESULTINSPECTION_RULESINSPECTION_SUMMARYKEY_COLUMN_USAGEMETRICS_SUMMARYMETRICS_TABLESPARTITIONSPLACEMENT_POLICIESPROCESSLISTREFERENTIAL_CONSTRAINTSSCHEMATASEQUENCESSESSION_VARIABLESSLOW_QUERYSTATISTICSTABLESTABLE_CONSTRAINTSTABLE_STORAGE_STATSTIDB_HOT_REGIONSTIDB_HOT_REGIONS_HISTORYTIDB_INDEXESTIDB_SERVERS_INFOTIDB_TRXTIFLASH_REPLICATIKV_REGION_PEERSTIKV_REGION_STATUSTIKV_STORE_STATUSUSER_PRIVILEGESVIEWS
METRICS_SCHEMA
- UI
- TiDB Dashboard
- Overview
- Maintain
- Access
- Overview Page
- Cluster Info Page
- Top SQL Page
- Key Visualizer Page
- Metrics Relation Graph
- SQL Statements Analysis
- Slow Queries Page
- Cluster Diagnostics
- Search Logs Page
- Instance Profiling
- Session Management and Configuration
- FAQ
- CLI
- Command Line Flags
- Configuration File Parameters
- System Variables
- Storage Engines
- Telemetry
- Errors Codes
- Table Filter
- Schedule Replicas by Topology Labels
- FAQs
- Release Notes
- All Releases
- Release Timeline
- TiDB Versioning
- v6.1
- v6.0
- v5.4
- v5.3
- v5.2
- v5.1
- v5.0
- v4.0
- v3.1
- v3.0
- v2.1
- v2.0
- v1.0
- Glossary
Best Practices for TiKV Performance Tuning with Massive Regions
In TiDB, data is split into Regions, each storing data for a specific key range. These Regions are distributed among multiple TiKV instances. As data is written into a cluster, millions of or even tens of millions of Regions are created. Too many Regions on a single TiKV instance can bring a heavy burden to the cluster and affect its performance.
This document introduces the workflow of Raftstore (a core module of TiKV), explains why a massive amount of Regions affect the performance, and offers methods for tuning TiKV performance.
Raftstore workflow
A TiKV instance has multiple Regions on it. The Raftstore module drives the Raft state machine to process Region messages. These messages include processing read or write requests on Regions, persisting or replicating Raft logs, and processing Raft heartbeats. However, an increasing number of Regions can affect performance of the whole cluster. To understand this, it is necessary to learn the workflow of Raftstore shown as follows:
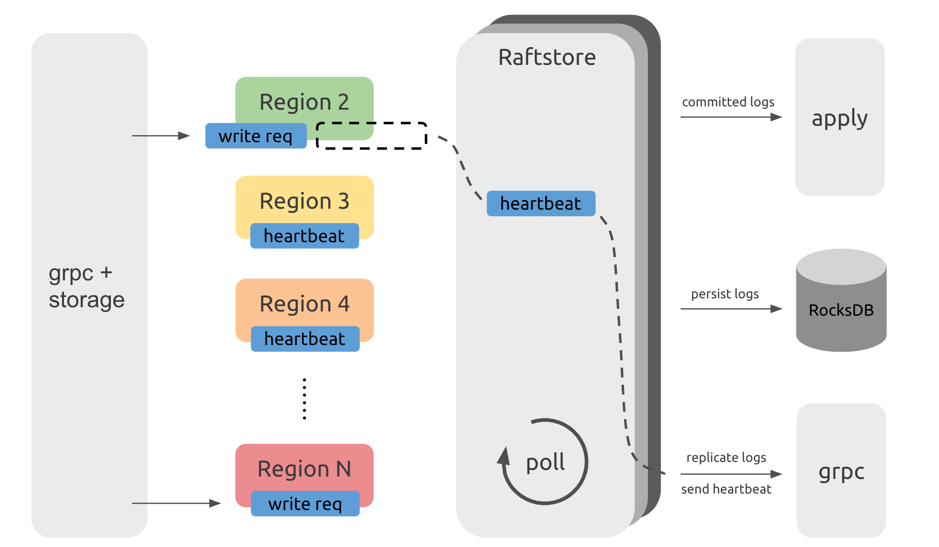
This diagram only illustrates the workflow of Raftstore and does not represent the actual code structure.
From the above diagram, you can see that requests from the TiDB servers, after passing through the gRPC and storage modules, become read and write messages of KV (key-value), and are sent to the corresponding Regions. These messages are not immediately processed but are temporarily stored. Raftstore polls to check whether each Region has messages to process. If a Region has messages to process, Raftstore drives the Raft state machine of this Region to process these messages and perform subsequent operations according to the state changes of these messages. For example, when write requests come in, the Raft state machine stores logs into disk and sends logs to other Region replicas; when the heartbeat interval is reached, the Raft state machine sends heartbeat information to other Region replicas.
Performance problem
From the Raftstore workflow diagram, messages in each Region are processed one by one. When a large number of Regions exist, it takes Raftstore some time to process the heartbeats of these Regions, which can cause some delay. As a result, some read and write requests are not processed in time. If read and write pressure is high, the CPU usage of the Raftstore thread might easily become the bottleneck, which further increases the delay and affects the performance.
Generally, if the CPU usage of the loaded Raftstore reaches 85% or higher, Raftstore goes into a busy state and becomes the bottleneck. At the same time, propose wait duration can be as high as hundreds of milliseconds.
- For the CPU usage of Raftstore as mentioned above, Raftstore is single-threaded. If Raftstore is multi-threaded, you can increase the CPU usage threshold (85%) proportionally.
- Because I/O operations exist in the Raftstore thread, CPU usage cannot reach 100%.
Performance monitoring
You can check the following monitoring metrics in Grafana's TiKV Dashboard:
Raft store CPUin the Thread-CPU panelReference value: lower than
raftstore.store-pool-size * 85%.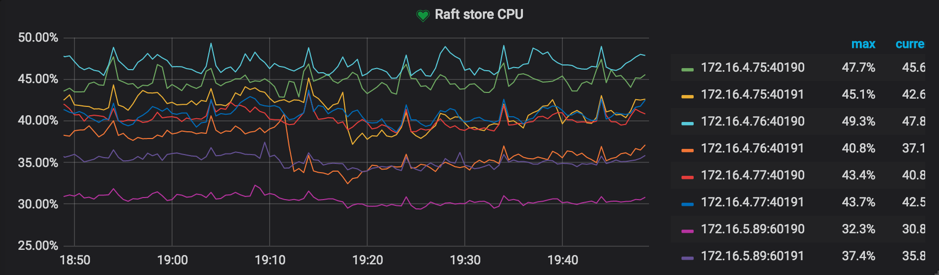
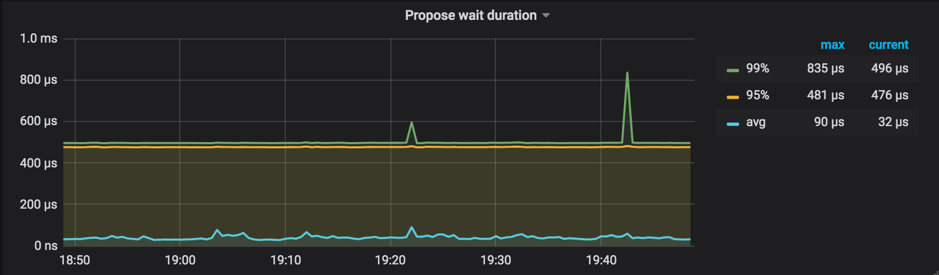
Propose wait durationin the Raft Propose panelPropose wait durationis the delay between the time a request is sent to Raftstore and the time Raftstore actually starts processing the request. Long delay means that Raftstore is busy, or that processing the append log is time-consuming, making Raftstore unable to process the request in time.Reference value: lower than 50~100 ms according to the cluster size
Performance tuning methods
After finding out the cause of a performance problem, try to solve it from the following two aspects:
- Reduce the number of Regions on a single TiKV instance
- Reduce the number of messages for a single Region
Method 1: Increase Raftstore concurrency
Raftstore has been upgraded to a multi-threaded module since TiDB v3.0, which greatly reduces the possibility that a Raftstore thread becomes the bottleneck.
By default, raftstore.store-pool-size is configured to 2 in TiKV. If a bottleneck occurs in Raftstore, you can properly increase the value of this configuration item according to the actual situation. But to avoid introducing unnecessary thread switching overhead, it is recommended that you do not set this value too high.
Method 2: Enable Hibernate Region
In the actual situation, read and write requests are not evenly distributed on every Region. Instead, they are concentrated on a few Regions. Then you can minimize the number of messages between the Raft leader and the followers for the temporarily idle Regions, which is the feature of Hibernate Region. In this feature, Raftstore does sent tick messages to the Raft state machines of idle Regions if not necessary. Then these Raft state machines will not be triggered to generate heartbeat messages, which can greatly reduce the workload of Raftstore.
Hibernate Region is enabled by default in TiKV master. You can configure this feature according to your needs. For details, refer to Configure Hibernate Region.
Method 3: Enable Region Merge
Region Merge is enabled by default since TiDB v3.0.
You can also reduce the number of Regions by enabling Region Merge. Contrary to Region Split, Region Merge is the process of merging adjacent small Regions through scheduling. After dropping data or executing the Drop Table or Truncate Table statement, you can merge small Regions or even empty Regions to reduce resource consumption.
Enable Region Merge by configuring the following parameters:
config set max-merge-region-size 20
config set max-merge-region-keys 200000
config set merge-schedule-limit 8
Refer to Region Merge and the following three configuration parameters in the PD configuration file for more details:
The default configuration of the Region Merge parameters is rather conservative. You can speed up the Region Merge process by referring to the method provided in PD Scheduling Best Practices.
Method 4: Increase the number of TiKV instances
If I/O resources and CPU resources are sufficient, you can deploy multiple TiKV instances on a single machine to reduce the number of Regions on a single TiKV instance; or you can increase the number of machines in the TiKV cluster.
Method 5: Adjust raft-base-tick-interval
In addition to reducing the number of Regions, you can also reduce pressure on Raftstore by reducing the number of messages for each Region within a unit of time. For example, you can properly increase the value of the raft-base-tick-interval configuration item:
[raftstore]
raft-base-tick-interval = "2s"
In the above configuration, raft-base-tick-interval is the time interval at which Raftstore drives the Raft state machine of each Region, which means at this time interval, Raftstore sends a tick message to the Raft state machine. Increasing this interval can effectively reduce the number of messages from Raftstore.
Note that this interval between tick messages also determines the intervals between election timeout and heartbeat. See the following example:
raft-election-timeout = raft-base-tick-interval * raft-election-timeout-ticks
raft-heartbeat-interval = raft-base-tick-interval * raft-heartbeat-ticks
If Region followers have not received the heartbeat from the leader within the raft-election-timeout interval, these followers determine that the leader has failed and start a new election. raft-heartbeat-interval is the interval at which a leader sends a heartbeat to followers. Therefore, increasing the value of raft-base-tick-interval can reduce the number of network messages sent from Raft state machines but also makes it longer for Raft state machines to detect the leader failure.
Method 6: Adjust Region size
The default size of a Region is 96 MiB, and you can reduce the number of Regions by setting Regions to a larger size. For more information, see Tune Region Performance.
Currently, customized Region size is an experimental feature introduced in TiDB v6.1.0. It is not recommended that you use it in production environments. The risks are as follows:
- Performance jitter might be caused.
- The query performance, especially for queries that deal with a large range of data, might decrease.
- The Region scheduling slows down.
Other problems and solutions
This section describes some other problems and solutions.
Switching PD Leader is slow
PD needs to persist Region Meta information on etcd to ensure that PD can quickly resume to provide Region routing services after switching the PD Leader node. As the number of Regions increases, the performance problem of etcd appears, making it slower for PD to get Region Meta information from etcd when PD is switching the Leader. With millions of Regions, it might take more than ten seconds or even tens of seconds to get the meta information from etcd.
To address this problem, use-region-storage is enabled by default in PD since TiDB v3.0. With this feature enabled, PD stores Region Meta information on local LevelDB and synchronizes the information among PD nodes through other mechanisms.
PD routing information is not updated in time
In TiKV, pd-worker regularly reports Region Meta information to PD. When TiKV is restarted or switches the Region leader, PD needs to recalculate Region's approximate size / keys through statistics. Therefore, with a large number of Regions, the single-threaded pd-worker might become the bottleneck, causing tasks to be piled up and not processed in time. In this situation, PD cannot obtain certain Region Meta information in time so that the routing information is not updated in time. This problem does not affect the actual reads and writes, but might cause inaccurate PD scheduling and require several round trips when TiDB updates Region cache.
You can check Worker pending tasks under Task in the TiKV Grafana panel to determine whether pd-worker has tasks piled up. Generally, pending tasks should be kept at a relatively low value.
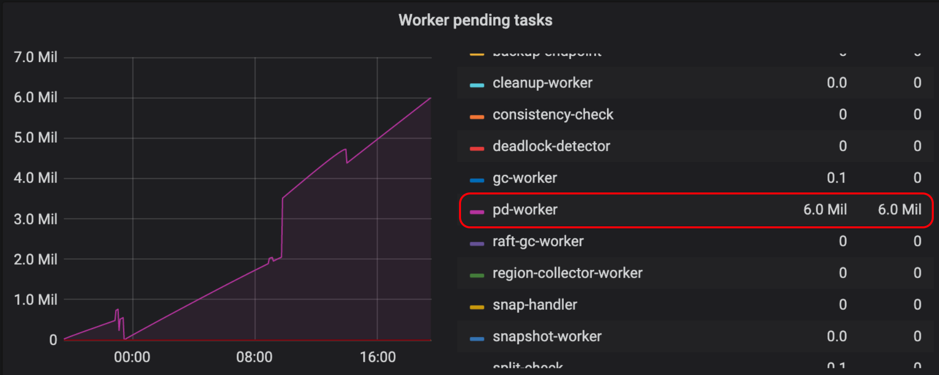
pd-worker has been optimized for better performance since v3.0.5. If you encounter a similar problem, it is recommended to upgrade to the latest version.
Prometheus is slow to query metrics
In a large-scale cluster, as the number of TiKV instances increases, Prometheus has greater pressure to query metrics, making it slower for Grafana to display these metrics. To ease this problem, metrics pre-calculation is configured since v3.0.