- Docs Home
- About TiDB Cloud
- Get Started
- Develop Applications
- Overview
- Quick Start
- Build a TiDB Developer Cluster
- CRUD SQL in TiDB
- Build a Simple CRUD App with TiDB
- Example Applications
- Connect to TiDB
- Design Database Schema
- Write Data
- Read Data
- Transaction
- Optimize
- Troubleshoot
- Reference
- Cloud Native Development Environment
- Manage Cluster
- Plan Your Cluster
- Create a TiDB Cluster
- Connect to Your TiDB Cluster
- Set Up VPC Peering Connections
- Use an HTAP Cluster with TiFlash
- Scale a TiDB Cluster
- Upgrade a TiDB Cluster
- Delete a TiDB Cluster
- Use TiDB Cloud API (Beta)
- Migrate Data
- Import Sample Data
- Migrate Data into TiDB
- Configure Amazon S3 Access and GCS Access
- Migrate from MySQL-Compatible Databases
- Migrate Incremental Data from MySQL-Compatible Databases
- Migrate from Amazon Aurora MySQL in Bulk
- Import or Migrate from Amazon S3 or GCS to TiDB Cloud
- Import CSV Files from Amazon S3 or GCS into TiDB Cloud
- Import Apache Parquet Files from Amazon S3 or GCS into TiDB Cloud
- Troubleshoot Access Denied Errors during Data Import from Amazon S3
- Export Data from TiDB
- Back Up and Restore
- Monitor and Alert
- Overview
- Built-in Monitoring
- Built-in Alerting
- Third-Party Monitoring Integrations
- Tune Performance
- Overview
- Analyze Performance
- SQL Tuning
- Overview
- Understanding the Query Execution Plan
- SQL Optimization Process
- Overview
- Logic Optimization
- Physical Optimization
- Prepare Execution Plan Cache
- Control Execution Plans
- TiKV Follower Read
- Coprocessor Cache
- Garbage Collection (GC)
- Tune TiFlash performance
- Manage User Access
- Billing
- Reference
- TiDB Cluster Architecture
- TiDB Cloud Cluster Limits and Quotas
- TiDB Limitations
- SQL
- Explore SQL with TiDB
- SQL Language Structure and Syntax
- SQL Statements
ADD COLUMNADD INDEXADMINADMIN CANCEL DDLADMIN CHECKSUM TABLEADMIN CHECK [TABLE|INDEX]ADMIN SHOW DDL [JOBS|QUERIES]ALTER DATABASEALTER INDEXALTER TABLEALTER TABLE COMPACTALTER USERANALYZE TABLEBATCHBEGINCHANGE COLUMNCOMMITCHANGE DRAINERCHANGE PUMPCREATE [GLOBAL|SESSION] BINDINGCREATE DATABASECREATE INDEXCREATE ROLECREATE SEQUENCECREATE TABLE LIKECREATE TABLECREATE USERCREATE VIEWDEALLOCATEDELETEDESCDESCRIBEDODROP [GLOBAL|SESSION] BINDINGDROP COLUMNDROP DATABASEDROP INDEXDROP ROLEDROP SEQUENCEDROP STATSDROP TABLEDROP USERDROP VIEWEXECUTEEXPLAIN ANALYZEEXPLAINFLASHBACK TABLEFLUSH PRIVILEGESFLUSH STATUSFLUSH TABLESGRANT <privileges>GRANT <role>INSERTKILL [TIDB]MODIFY COLUMNPREPARERECOVER TABLERENAME INDEXRENAME TABLEREPLACEREVOKE <privileges>REVOKE <role>ROLLBACKSELECTSET DEFAULT ROLESET [NAMES|CHARACTER SET]SET PASSWORDSET ROLESET TRANSACTIONSET [GLOBAL|SESSION] <variable>SHOW ANALYZE STATUSSHOW [GLOBAL|SESSION] BINDINGSSHOW BUILTINSSHOW CHARACTER SETSHOW COLLATIONSHOW [FULL] COLUMNS FROMSHOW CREATE SEQUENCESHOW CREATE TABLESHOW CREATE USERSHOW DATABASESSHOW DRAINER STATUSSHOW ENGINESSHOW ERRORSSHOW [FULL] FIELDS FROMSHOW GRANTSSHOW INDEX [FROM|IN]SHOW INDEXES [FROM|IN]SHOW KEYS [FROM|IN]SHOW MASTER STATUSSHOW PLUGINSSHOW PRIVILEGESSHOW [FULL] PROCESSSLISTSHOW PROFILESSHOW PUMP STATUSSHOW SCHEMASSHOW STATS_HEALTHYSHOW STATS_HISTOGRAMSSHOW STATS_METASHOW STATUSSHOW TABLE NEXT_ROW_IDSHOW TABLE REGIONSSHOW TABLE STATUSSHOW [FULL] TABLESSHOW [GLOBAL|SESSION] VARIABLESSHOW WARNINGSSHUTDOWNSPLIT REGIONSTART TRANSACTIONTABLETRACETRUNCATEUPDATEUSEWITH
- Data Types
- Functions and Operators
- Overview
- Type Conversion in Expression Evaluation
- Operators
- Control Flow Functions
- String Functions
- Numeric Functions and Operators
- Date and Time Functions
- Bit Functions and Operators
- Cast Functions and Operators
- Encryption and Compression Functions
- Locking Functions
- Information Functions
- JSON Functions
- Aggregate (GROUP BY) Functions
- Window Functions
- Miscellaneous Functions
- Precision Math
- Set Operations
- List of Expressions for Pushdown
- TiDB Specific Functions
- Clustered Indexes
- Constraints
- Generated Columns
- SQL Mode
- Table Attributes
- Transactions
- Views
- Partitioning
- Temporary Tables
- Cached Tables
- Character Set and Collation
- Read Historical Data
- System Tables
mysql- INFORMATION_SCHEMA
- Overview
ANALYZE_STATUSCLIENT_ERRORS_SUMMARY_BY_HOSTCLIENT_ERRORS_SUMMARY_BY_USERCLIENT_ERRORS_SUMMARY_GLOBALCHARACTER_SETSCLUSTER_INFOCOLLATIONSCOLLATION_CHARACTER_SET_APPLICABILITYCOLUMNSDATA_LOCK_WAITSDDL_JOBSDEADLOCKSENGINESKEY_COLUMN_USAGEPARTITIONSPROCESSLISTREFERENTIAL_CONSTRAINTSSCHEMATASEQUENCESSESSION_VARIABLESSLOW_QUERYSTATISTICSTABLESTABLE_CONSTRAINTSTABLE_STORAGE_STATSTIDB_HOT_REGIONS_HISTORYTIDB_INDEXESTIDB_SERVERS_INFOTIDB_TRXTIFLASH_REPLICATIKV_REGION_PEERSTIKV_REGION_STATUSTIKV_STORE_STATUSUSER_PRIVILEGESVIEWS
- System Variables
- API Reference
- Storage Engines
- Dumpling
- Table Filter
- Troubleshoot Inconsistency Between Data and Indexes
- FAQs
- Release Notes
- Support
- Glossary
SQL Tuning Overview
This document introduces how to tune SQL performance in TiDB Cloud. To get the best SQL performance, you can do the following:
- Tune SQL performance. There are many ways to optimize SQL performance, such as analyzing query statements, optimizing execution plans, and optimizing full table scan.
- Optimize schema design. Depending on your business workload type, you may need to optimize the schemas to avoid transaction conflicts or hotspots.
Tune SQL performance
To improve the performance of SQL statements, consider the following principles.
- Minimize the scope of the scanned data. It is always a best practice to scan only the minimum scope of data and avoid scanning all data.
- Use appropriate indexes. For each column in the
WHEREclause in a SQL statement, make sure that there is a corresponding index. Otherwise, theWHEREclause will scan the full table and result in poor performance. - Use appropriate Join types. Depending on the size and correlation of each table in the query, it is very important to choose the right Join type. Generally, the cost-based optimizer in TiDB automatically chooses the optimal Join type. However, in some cases, you may need to specify the Join type manually. For details, see Explain Statements That Use Joins.
- Use appropriate storage engines. It is recommended to use the TiFlash storage engine for Hybrid Transactional and Analytical Processing (HTAP) workloads. See HTAP Queries.
TiDB Cloud provides several tools to help you analyze slow queries on a cluster. The following sections describe several approaches to optimize slow queries.
Use Statement on the Diagnosis tab
The TiDB Cloud console provides a Statement sub-tab on the Diagnosis tab. It collects the execution statistics of SQL statements of all databases on the cluster. You can use it to identify and analyze SQL statements that consume a long time in total or in a single execution.
Note that on this sub-tab, SQL queries with the same structure (even if the query parameters do not match) are grouped into the same SQL statement. For example, SELECT * FROM employee WHERE id IN (1, 2, 3) and select * from EMPLOYEE where ID in (4, 5) are both part of the same SQL statement select * from employee where id in (...).
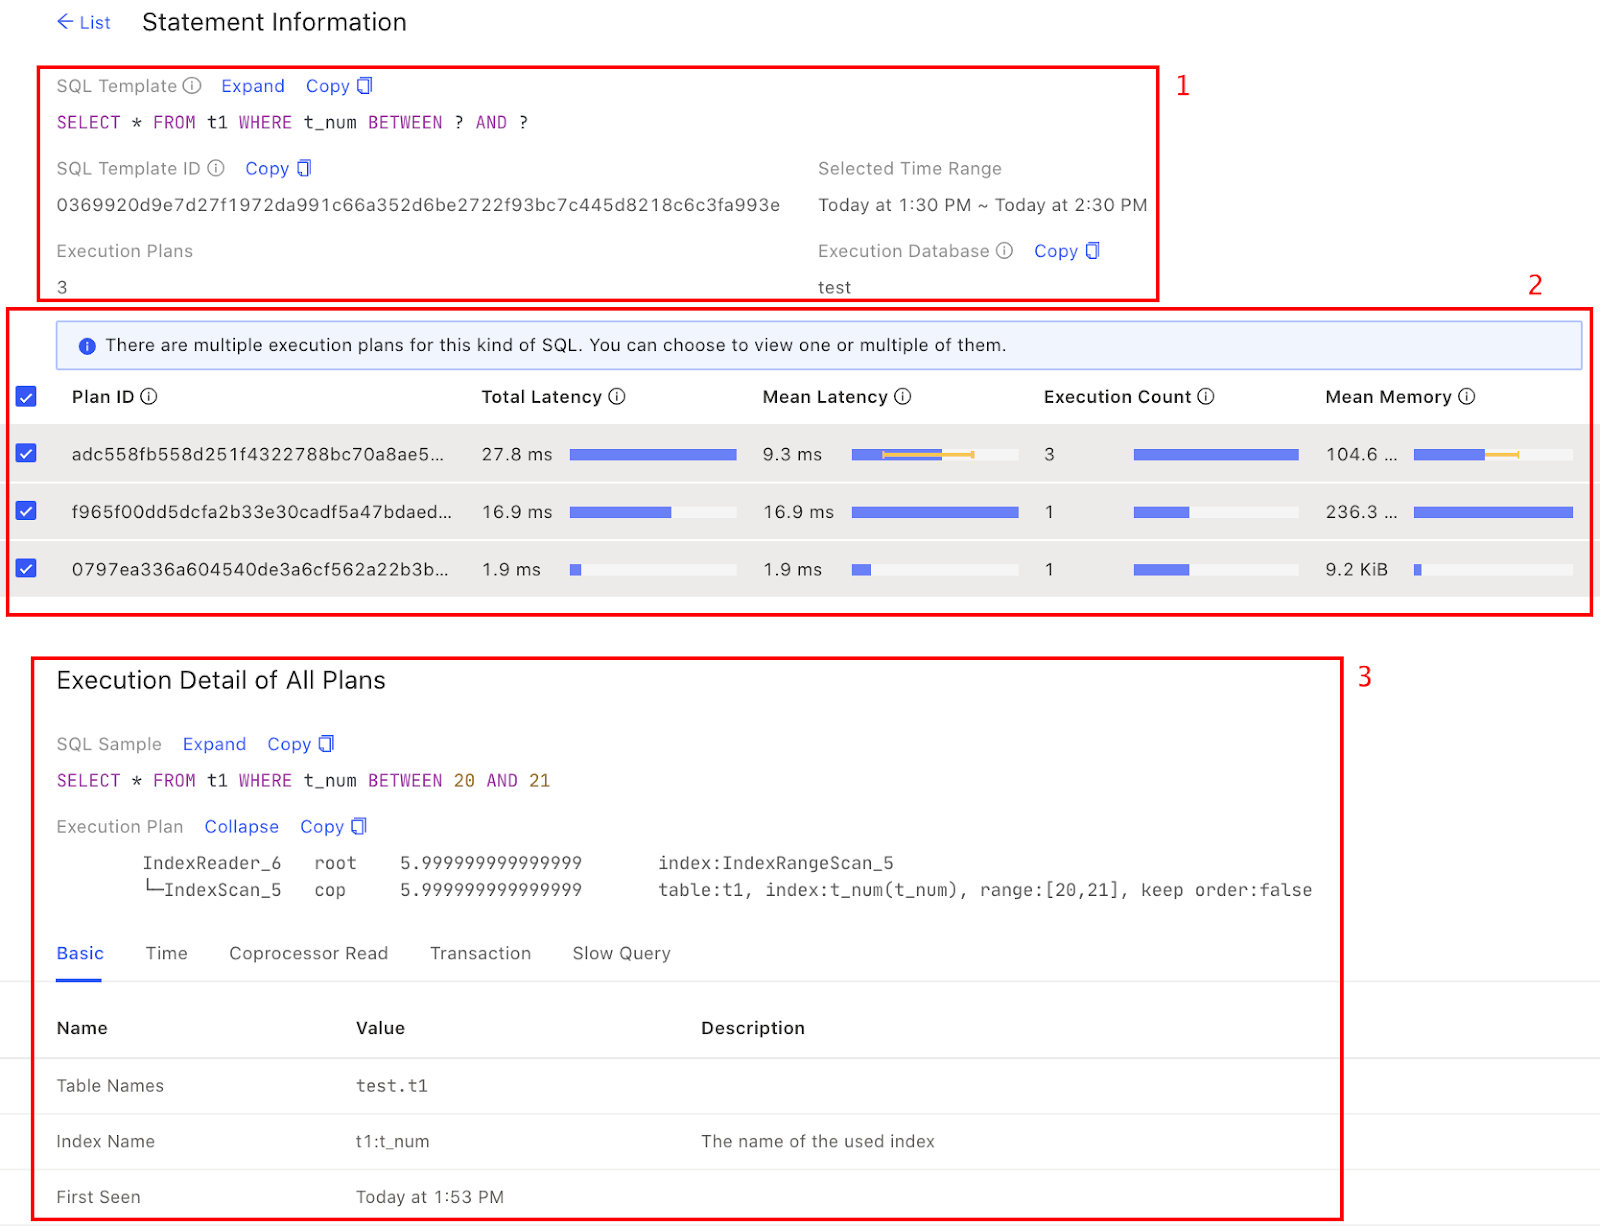
You can view some key information in Statement.
- SQL statement overview: including SQL digest, SQL template ID, the time range currently viewed, the number of execution plans, and the database where the execution takes place.
- Execution plan list: if a SQL statement has more than one execution plan, the list is displayed. You can select different execution plans and the details of the selected execution plan are displayed at the bottom of the list. If there is only one execution plan, the list will not be displayed.
- Execution plan details: shows the details of the selected execution plan. It collects the execution plans of such SQL type and the corresponding execution time from several perspectives to help you get more information. See Execution plan in details (area 3 in the image below).
In addition to the information in the Statement dashboard, there are also some SQL best practices for TiDB Cloud as described in the following sections.
Check the execution plan
You can use EXPLAIN to check the execution plan calculated by TiDB for a statement during compiling. In other words, TiDB estimates hundreds or thousands of possible execution plans and selects an optimal execution plan that consumes the least resource and executes the fastest.
If the execution plan selected by TiDB is not optimal, you can use EXPLAIN or EXPLAIN ANALYZE to diagnose it.
Optimize the execution plan
After parsing the original query text by parser and basic validity verification, TiDB first makes some logical equivalent changes to the query. For more information, see SQL Logical Optimization.
Through these equivalence changes, the query can become easier to handle in the logical execution plan. After the equivalence changes, TiDB gets a query plan structure that is equivalent to the original query, and then gets a final execution plan based on the data distribution and the specific execution overhead of an operator. For more information, see SQL Physical Optimization.
Also, TiDB can choose to enable execution plan cache to reduce the creation overhead of the execution plan when executing the PREPARE statement, as introduced in Prepare Execution Plan Cache.
Optimize full table scan
The most common reason for slow SQL queries is that the SELECT statements perform full table scan or use incorrect indexes. You can use EXPLAIN or EXPLAIN ANALYZE to view the execution plan of a query and locate the cause of the slow execution. There are three methods that you can use to optimize.
- Use secondary index
- Use covering index
- Use primary index
DML best practices
See DML best practices.
DDL best practices when selecting primary keys
See Guidelines to follow when selecting primary keys.
Index best practices
Best practices for indexing include best practices for creating indexes and using indexes.
The speed of creating indexes is conservative by default, and the index creation process can be accelerated by modifying variables in some scenarios.
Optimize schema design
If you still cannot get better performance based on SQL performance tuning, you may need to check your schema design and data read model to avoid transaction conflicts and hotspots.
Transaction conflicts
For more information on how to locate and resolve transaction conflicts, see Troubleshoot Lock Conflicts.
Hotspot issues
You can analyze hotspot issues using Key Visualizer.
You can use Key Visualizer to analyze the usage patterns of TiDB clusters and troubleshoot traffic hotspots. This page provides a visual representation of the TiDB cluster's traffic over time.
You can observe the following information in Key Visualizer. You may need to understand some basic concepts first.
- A large heat map that shows the overall traffic over time
- The detailed information about a coordinate of the heat map
- The identification information such as tables and indexes that is displayed on the left side
In Key Visualizer, there are four common heat map results.
- Evenly distributed workload: desired result
- Alternating brightness and darkness along the X-axis (time): need to check the resources at peak times
- Alternating brightness and darkness along the Y-axis: need to check the degree of hotspot aggregation generated
- Bright diagonal lines: need to check the business model
In both cases of X-axis and Y-axis alternating bright and dark, you need to address read and write pressure.
For more information about SQL performance optimization, see SQL Optimization in SQL FAQs.